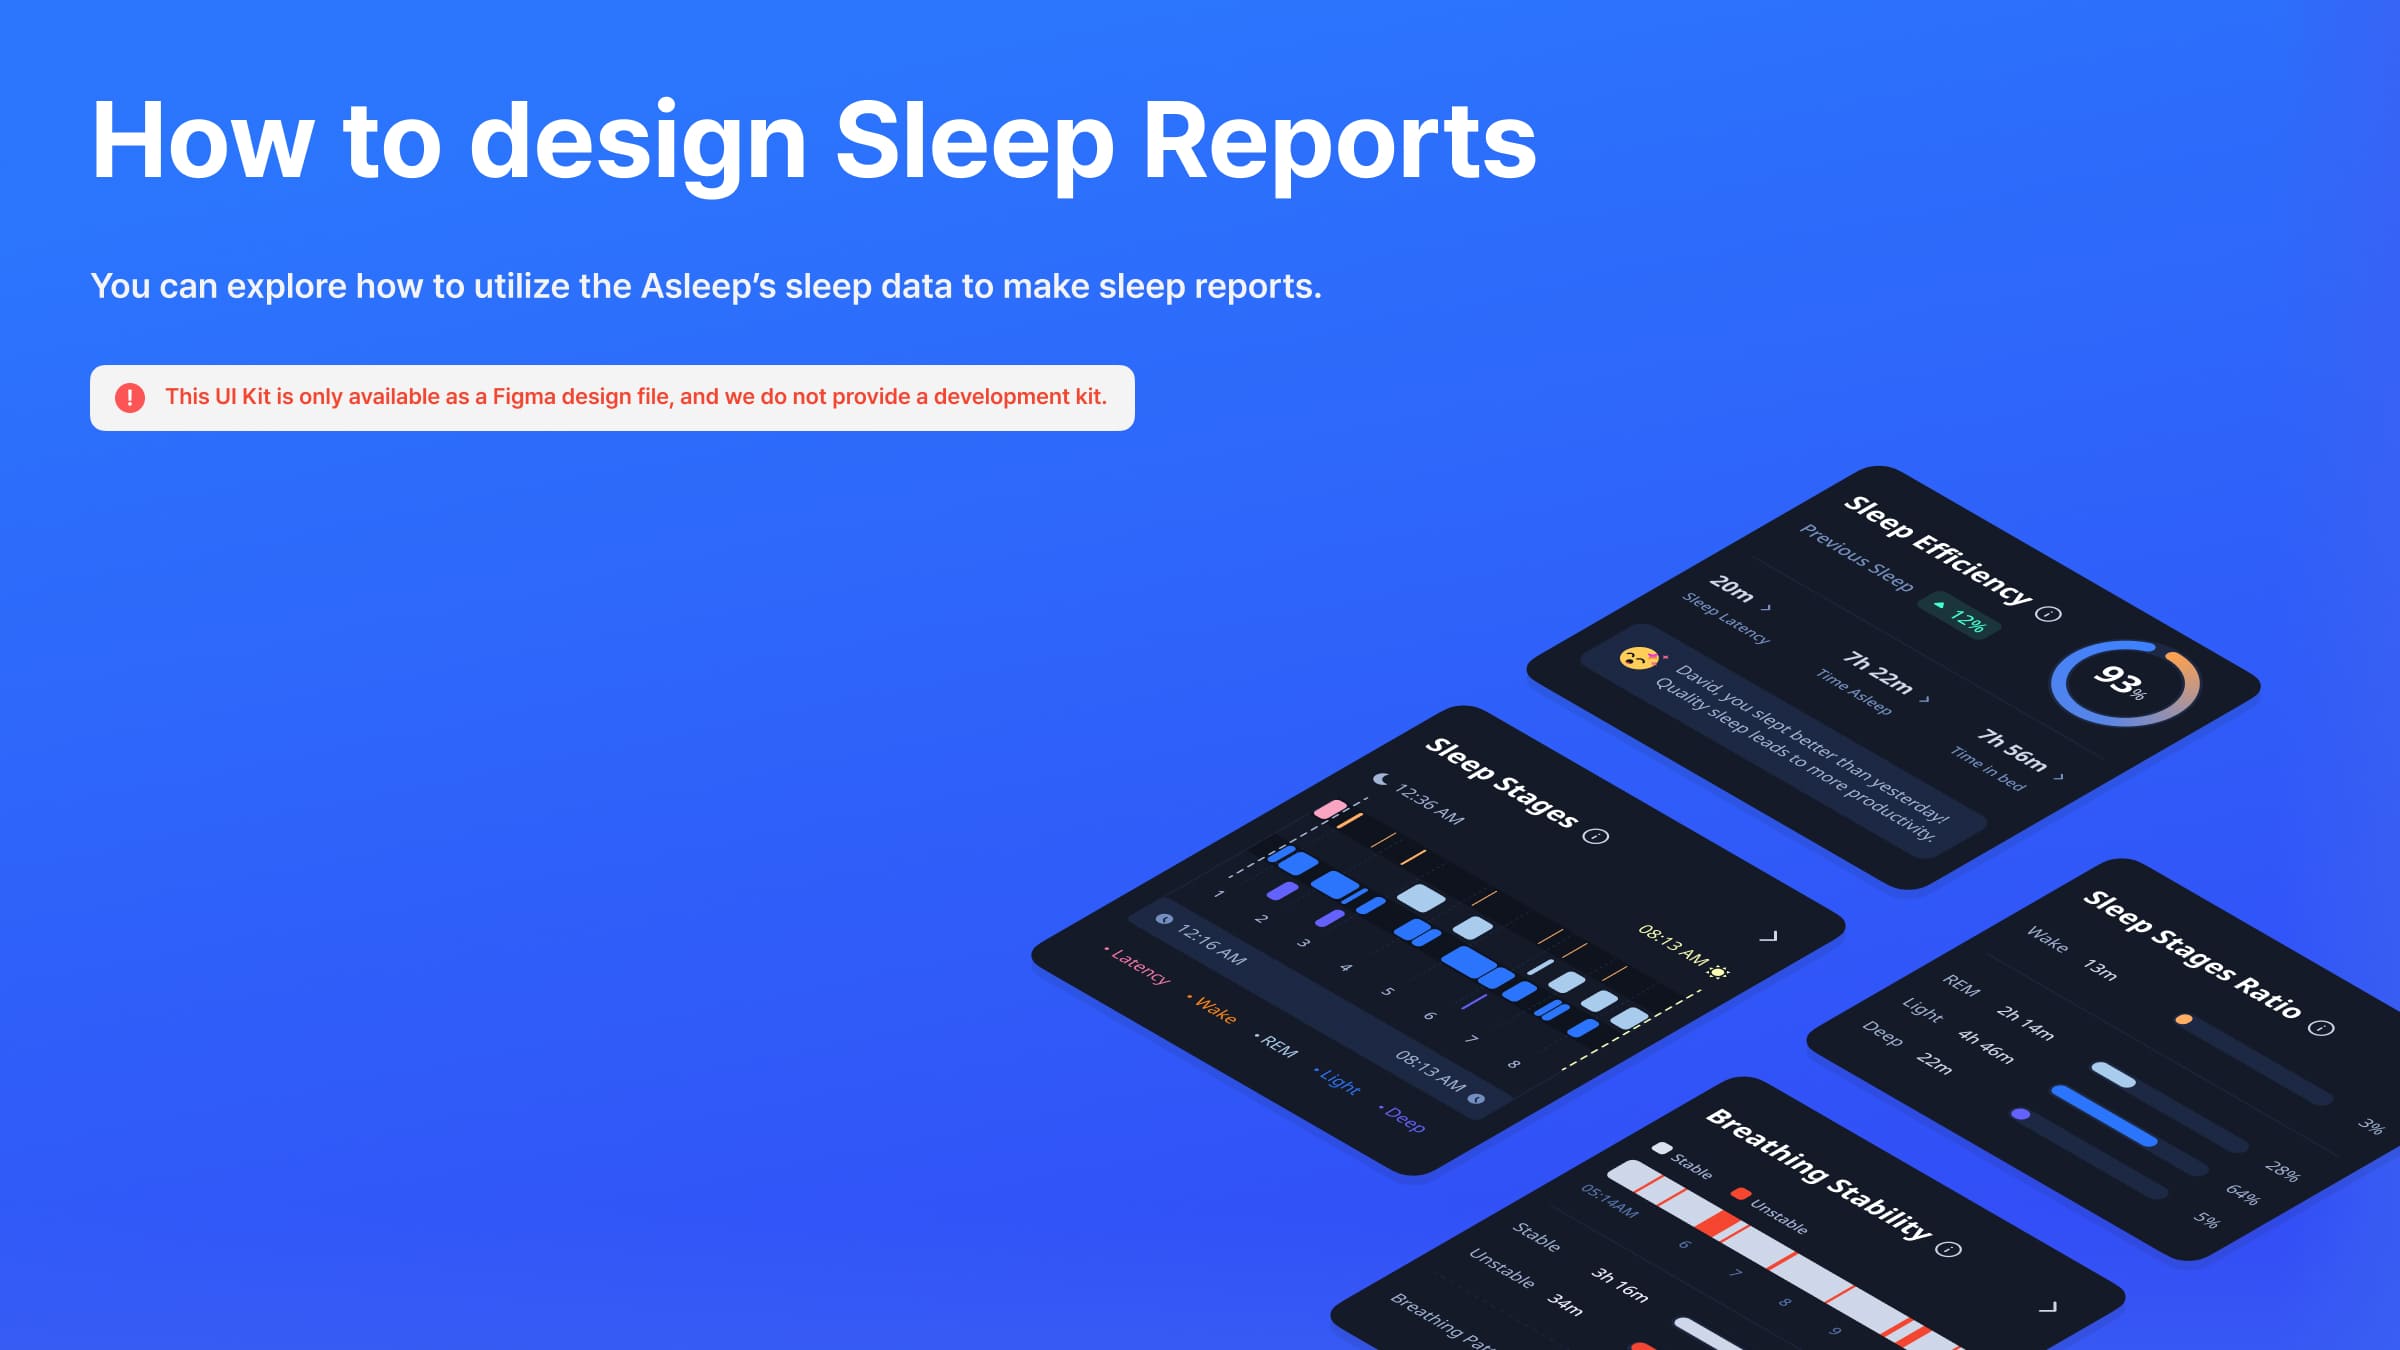
Sleep Report Design Guide
Discover how to design Sleep Report with SleepTrack data
Starting to design a sleep report can be daunting.
But don't worry! We'll explain how you can visualize SleepTrack's sleep data into a sleep report for easy understanding.
Basic Sleep Report
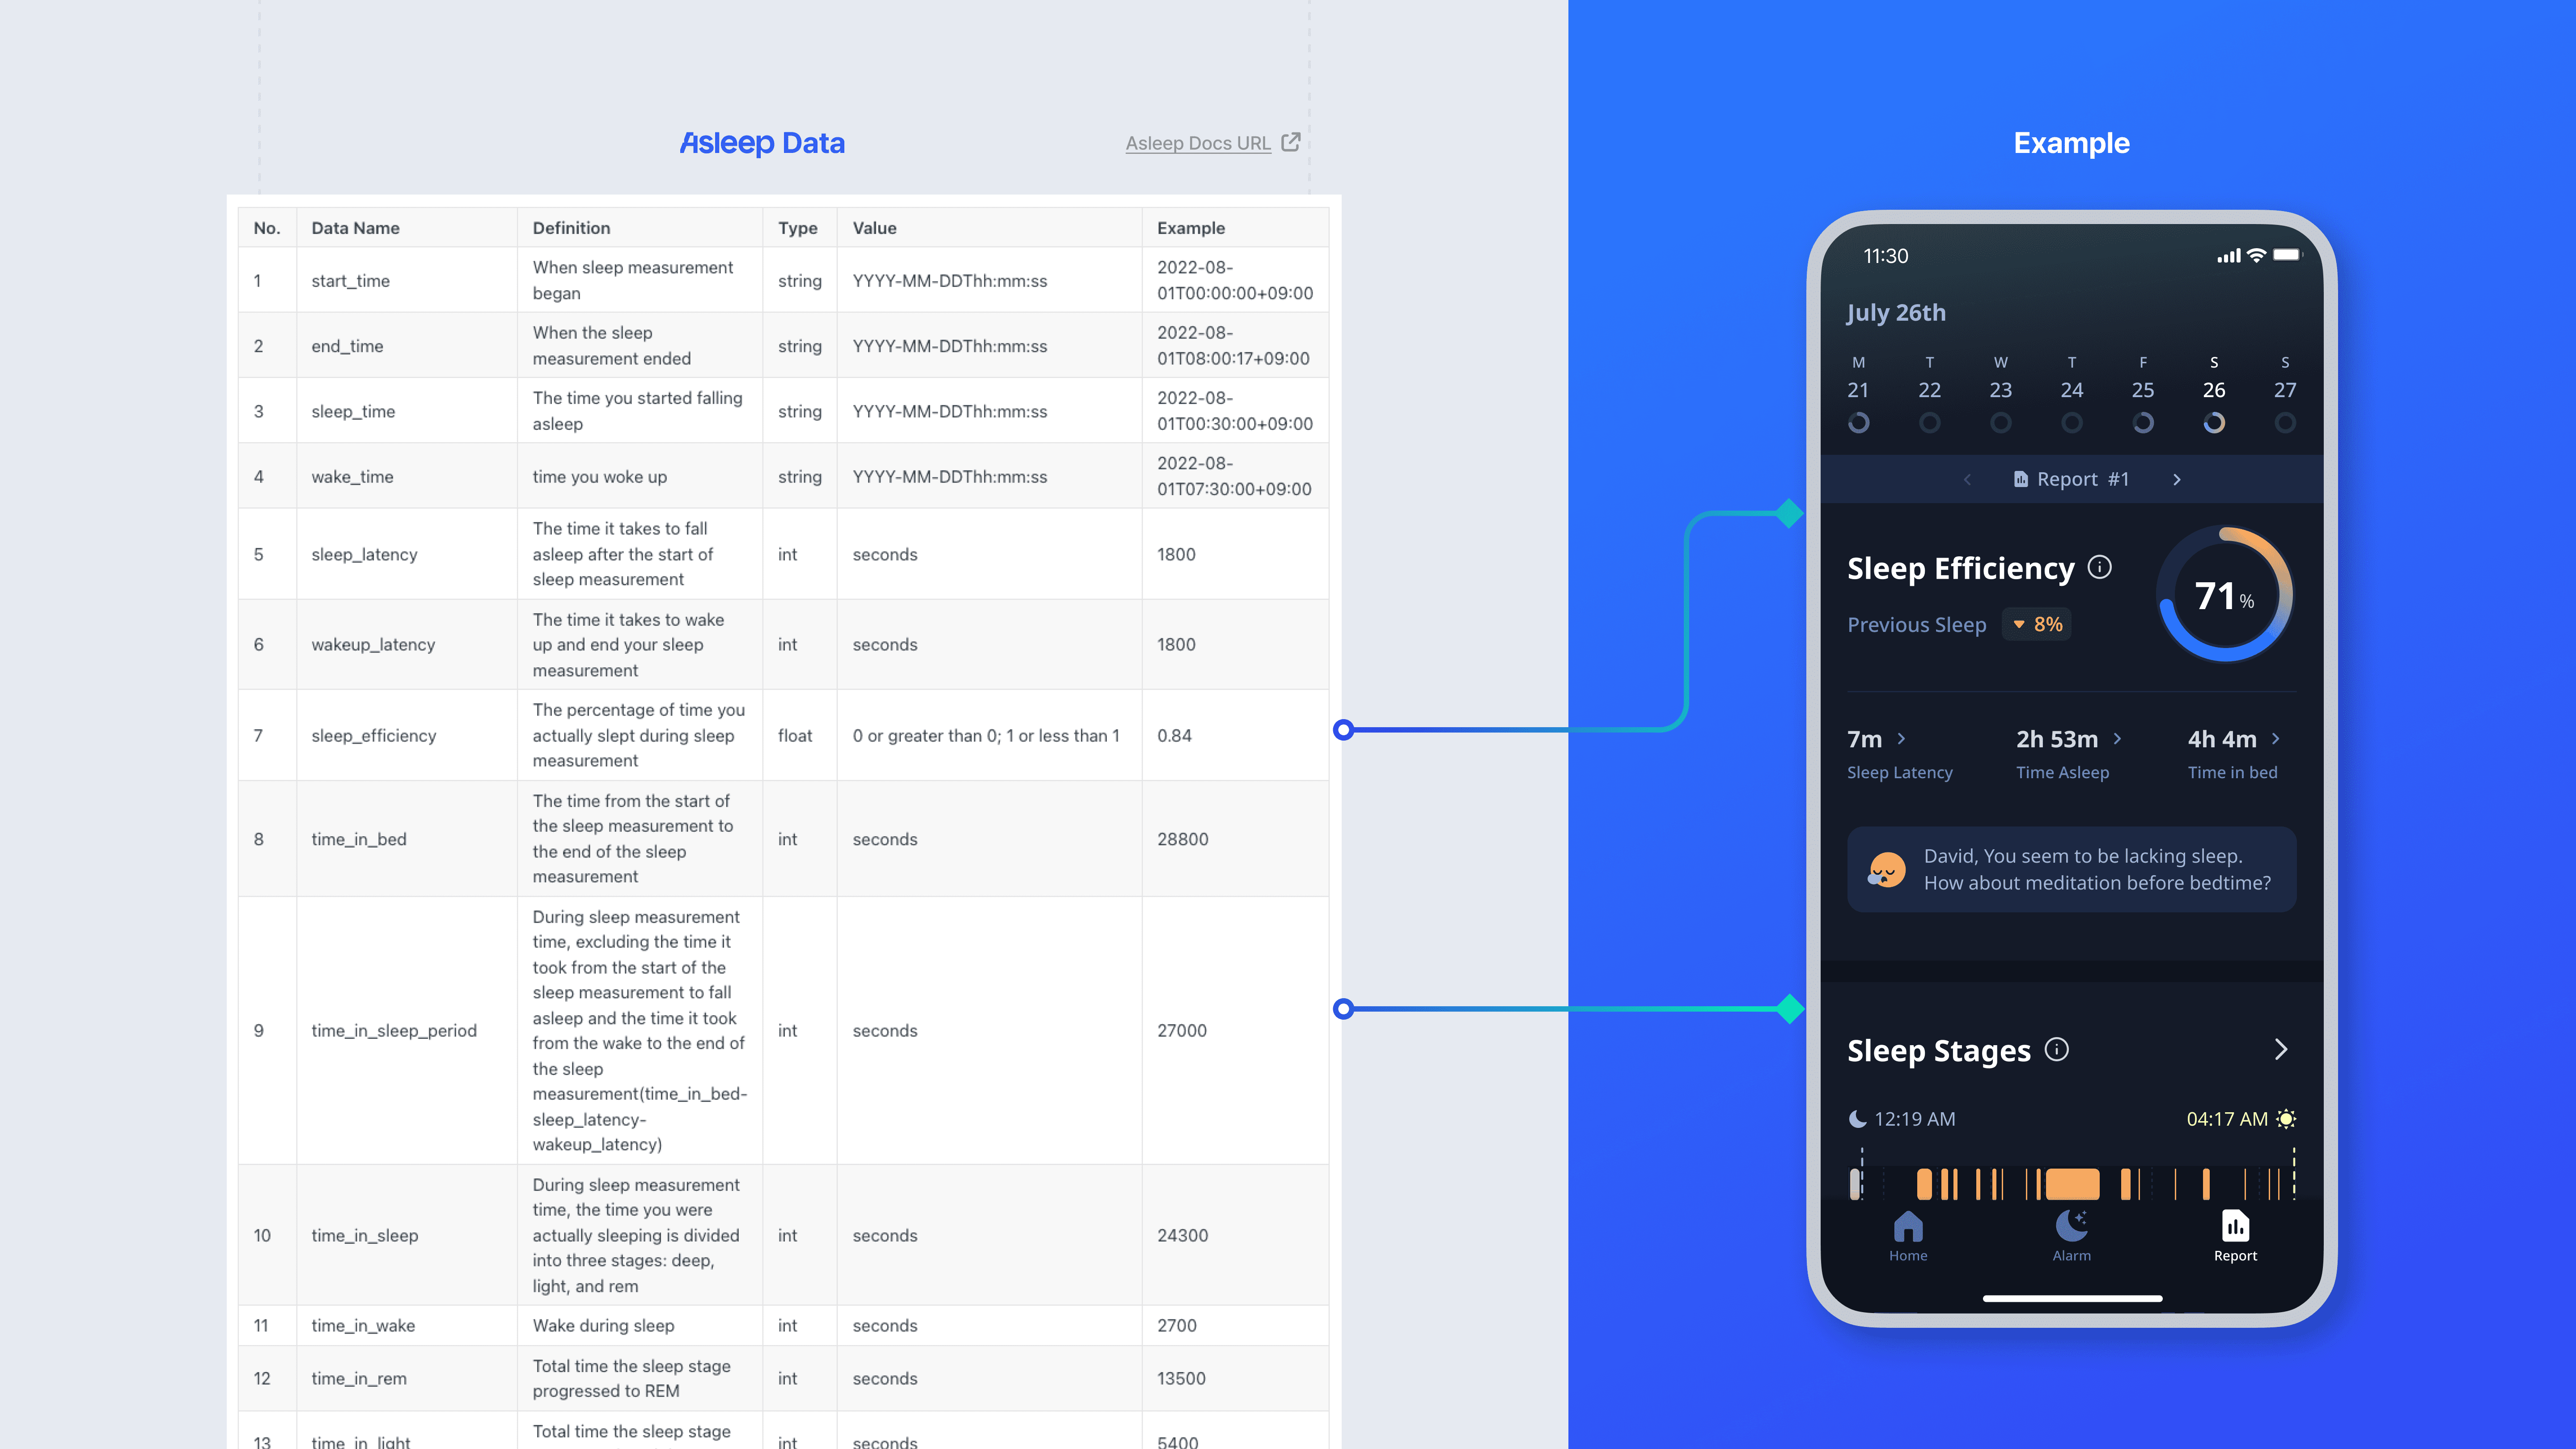
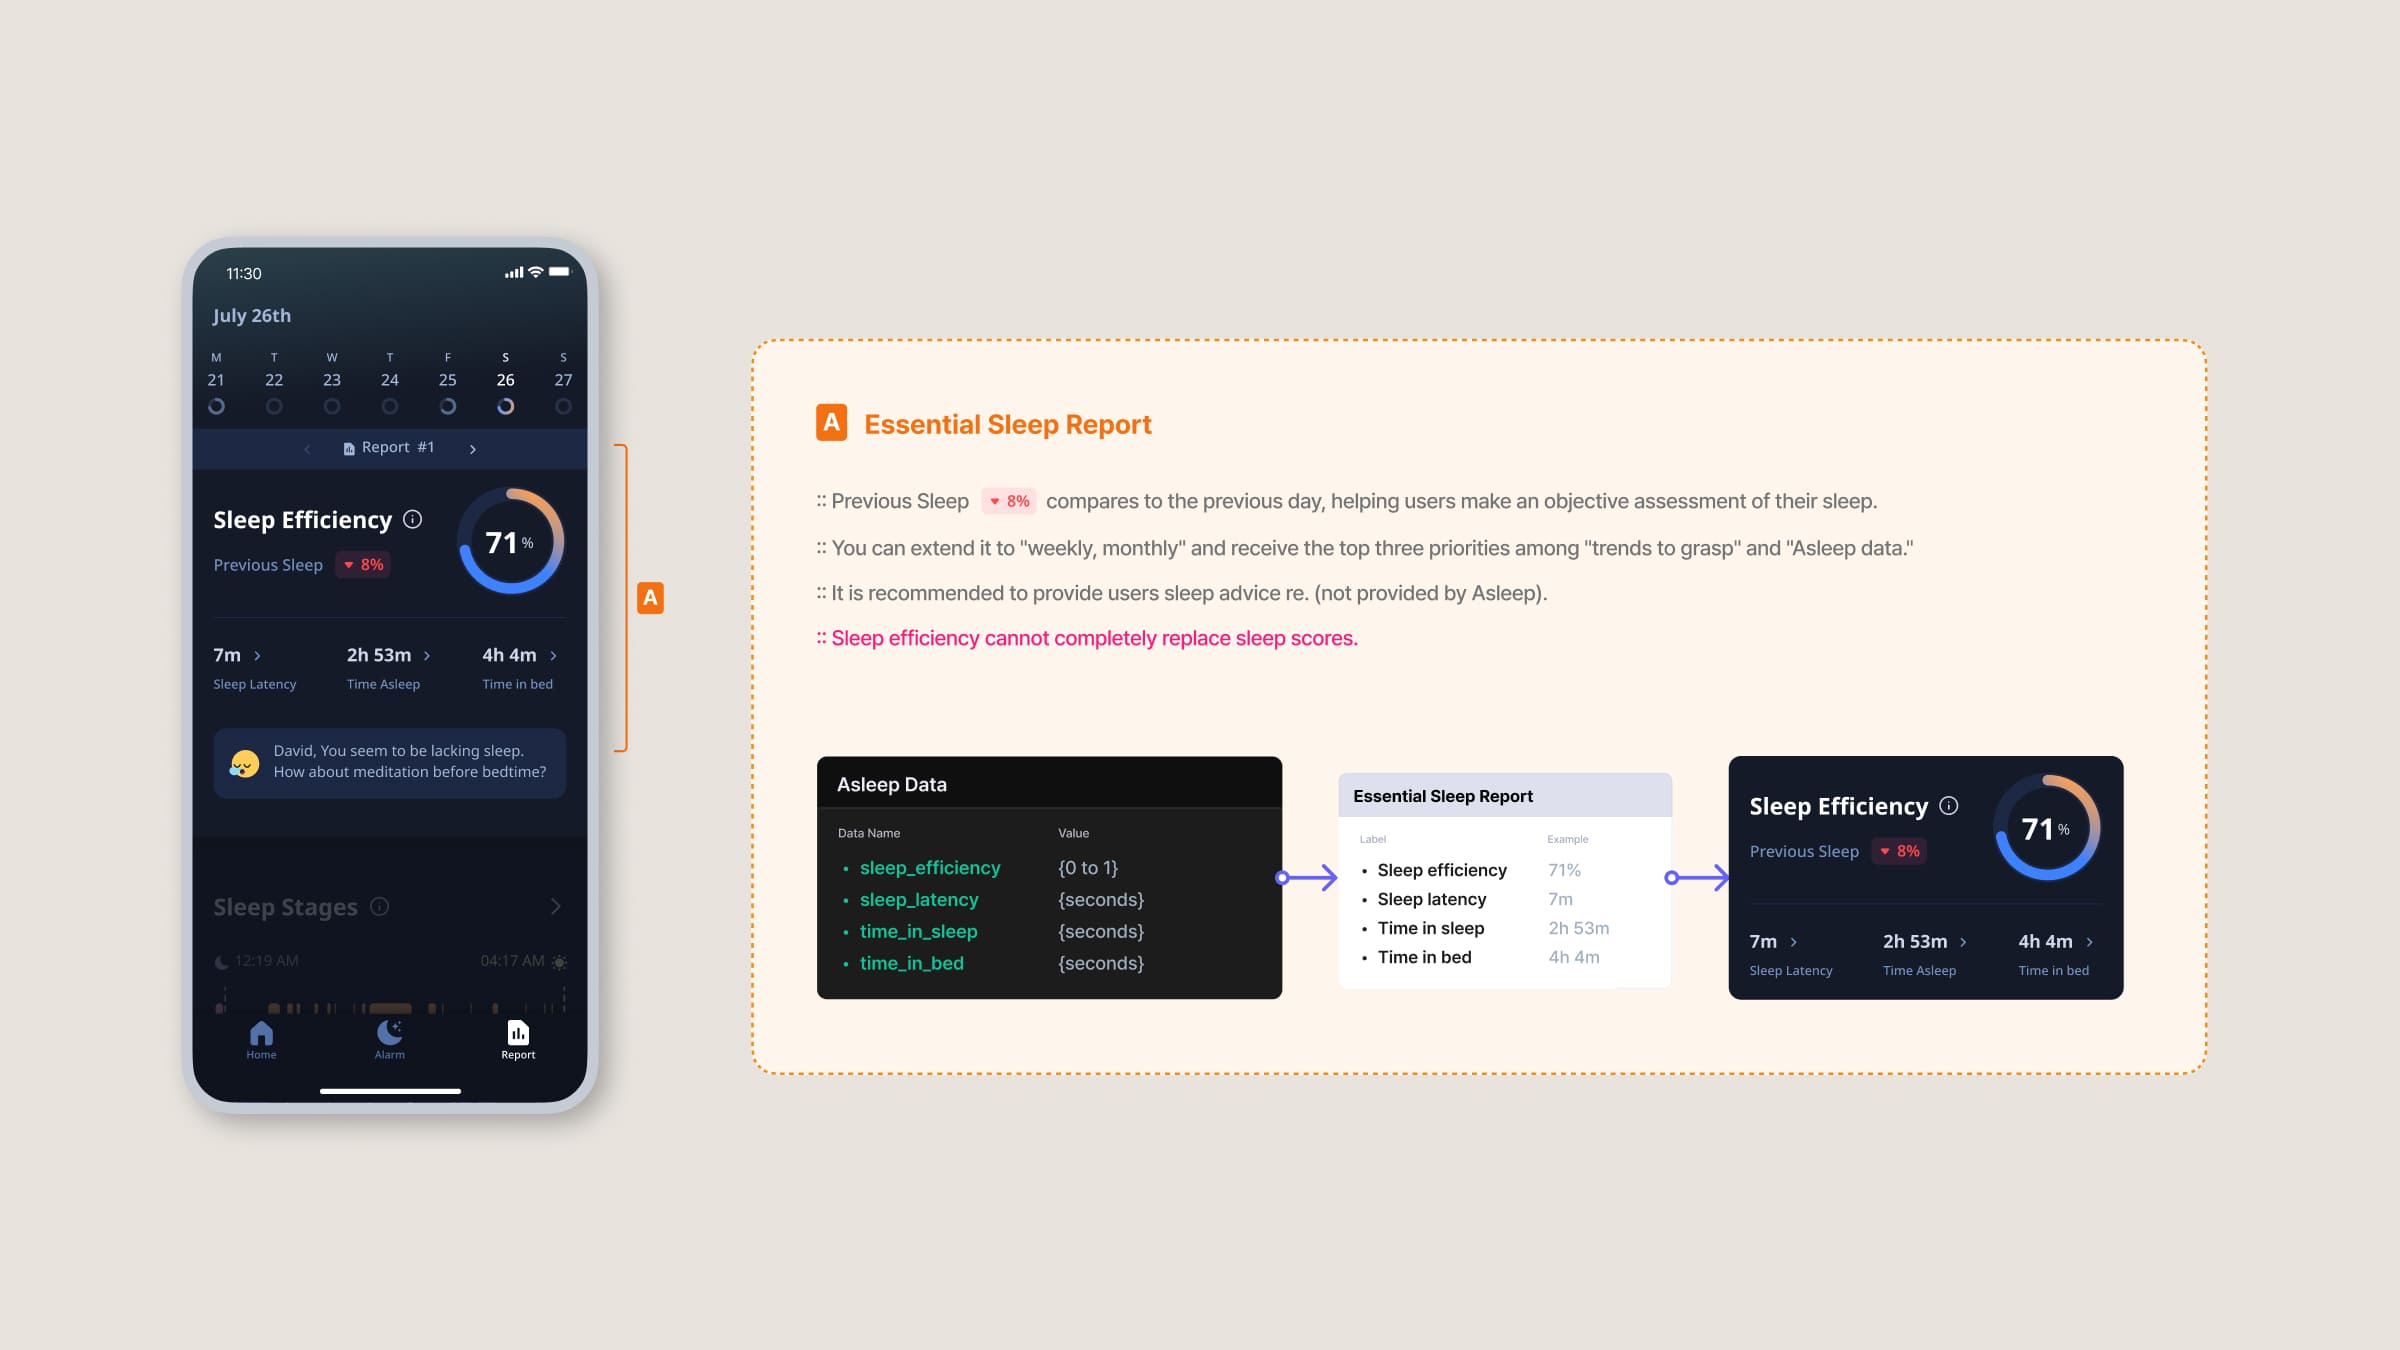
The data presented here constitutes fundamental sleep information that can be derived through a 2-stage sleep analysis. Through this information, essential insights into the user's sleep state are provided. Depending on the concept or purpose of the service, it's effective to highlight significant sleep data at the top of the report.
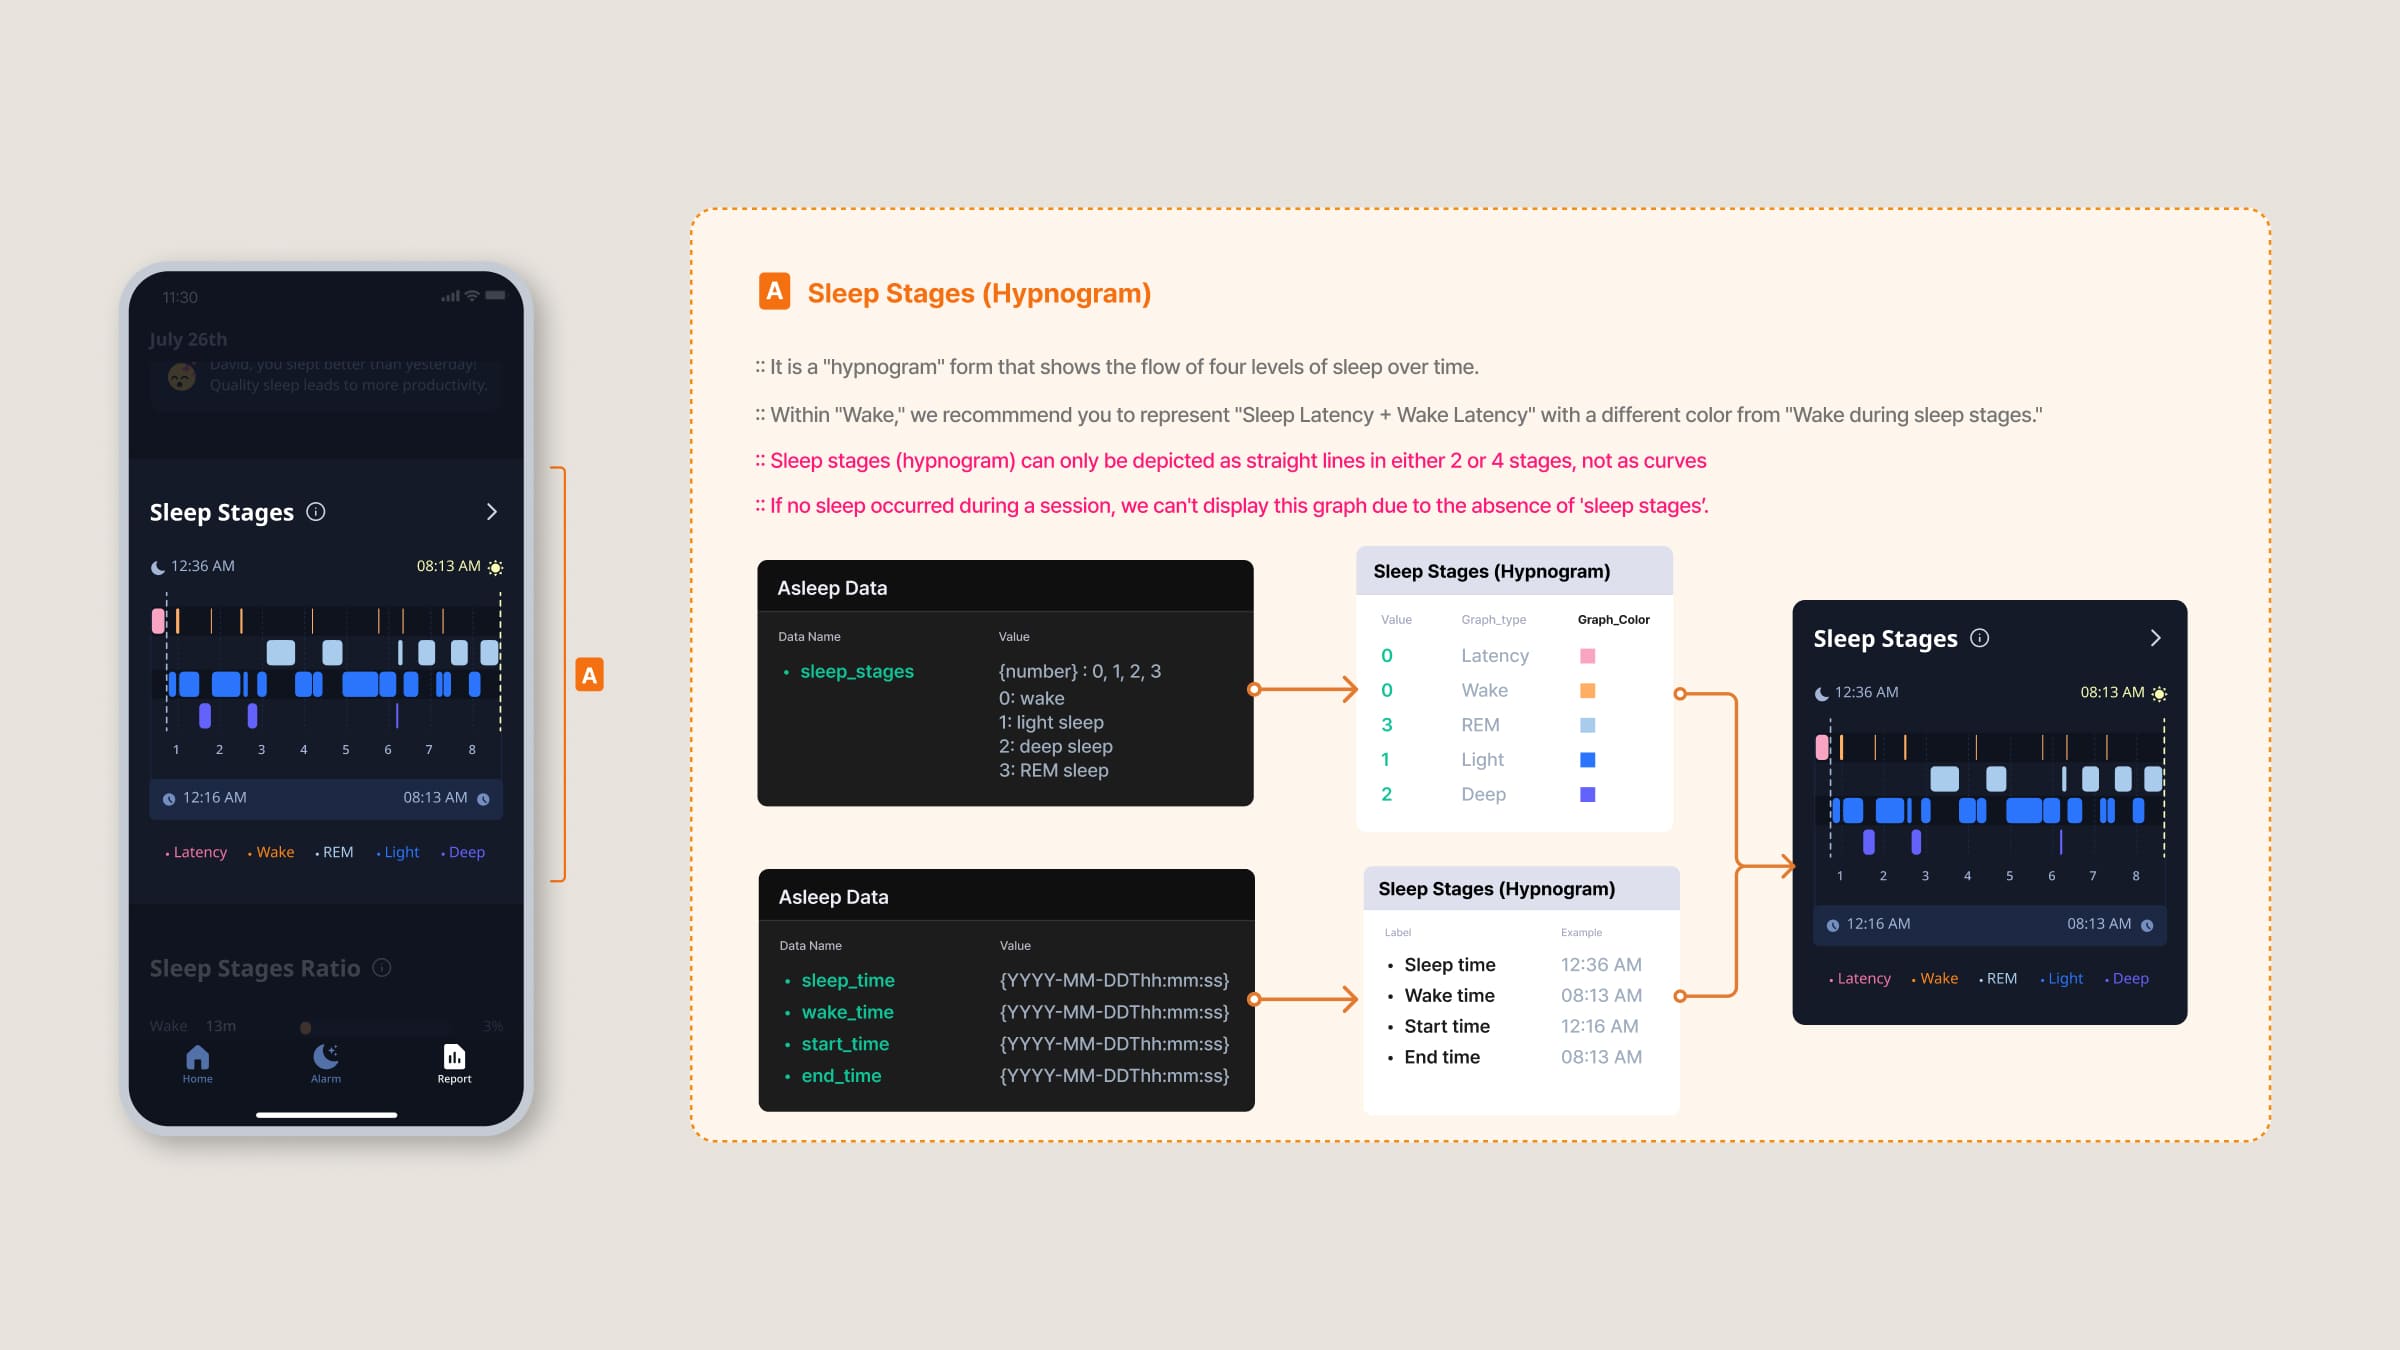
Sleep Stage (Hypnogram)
By checking the user's sleep report on a weekly and monthly basis, they can better understand their own sleep patterns. For example, through this graph, the user can see their average sleep and wakeup times, and easily understand their sleep trend.
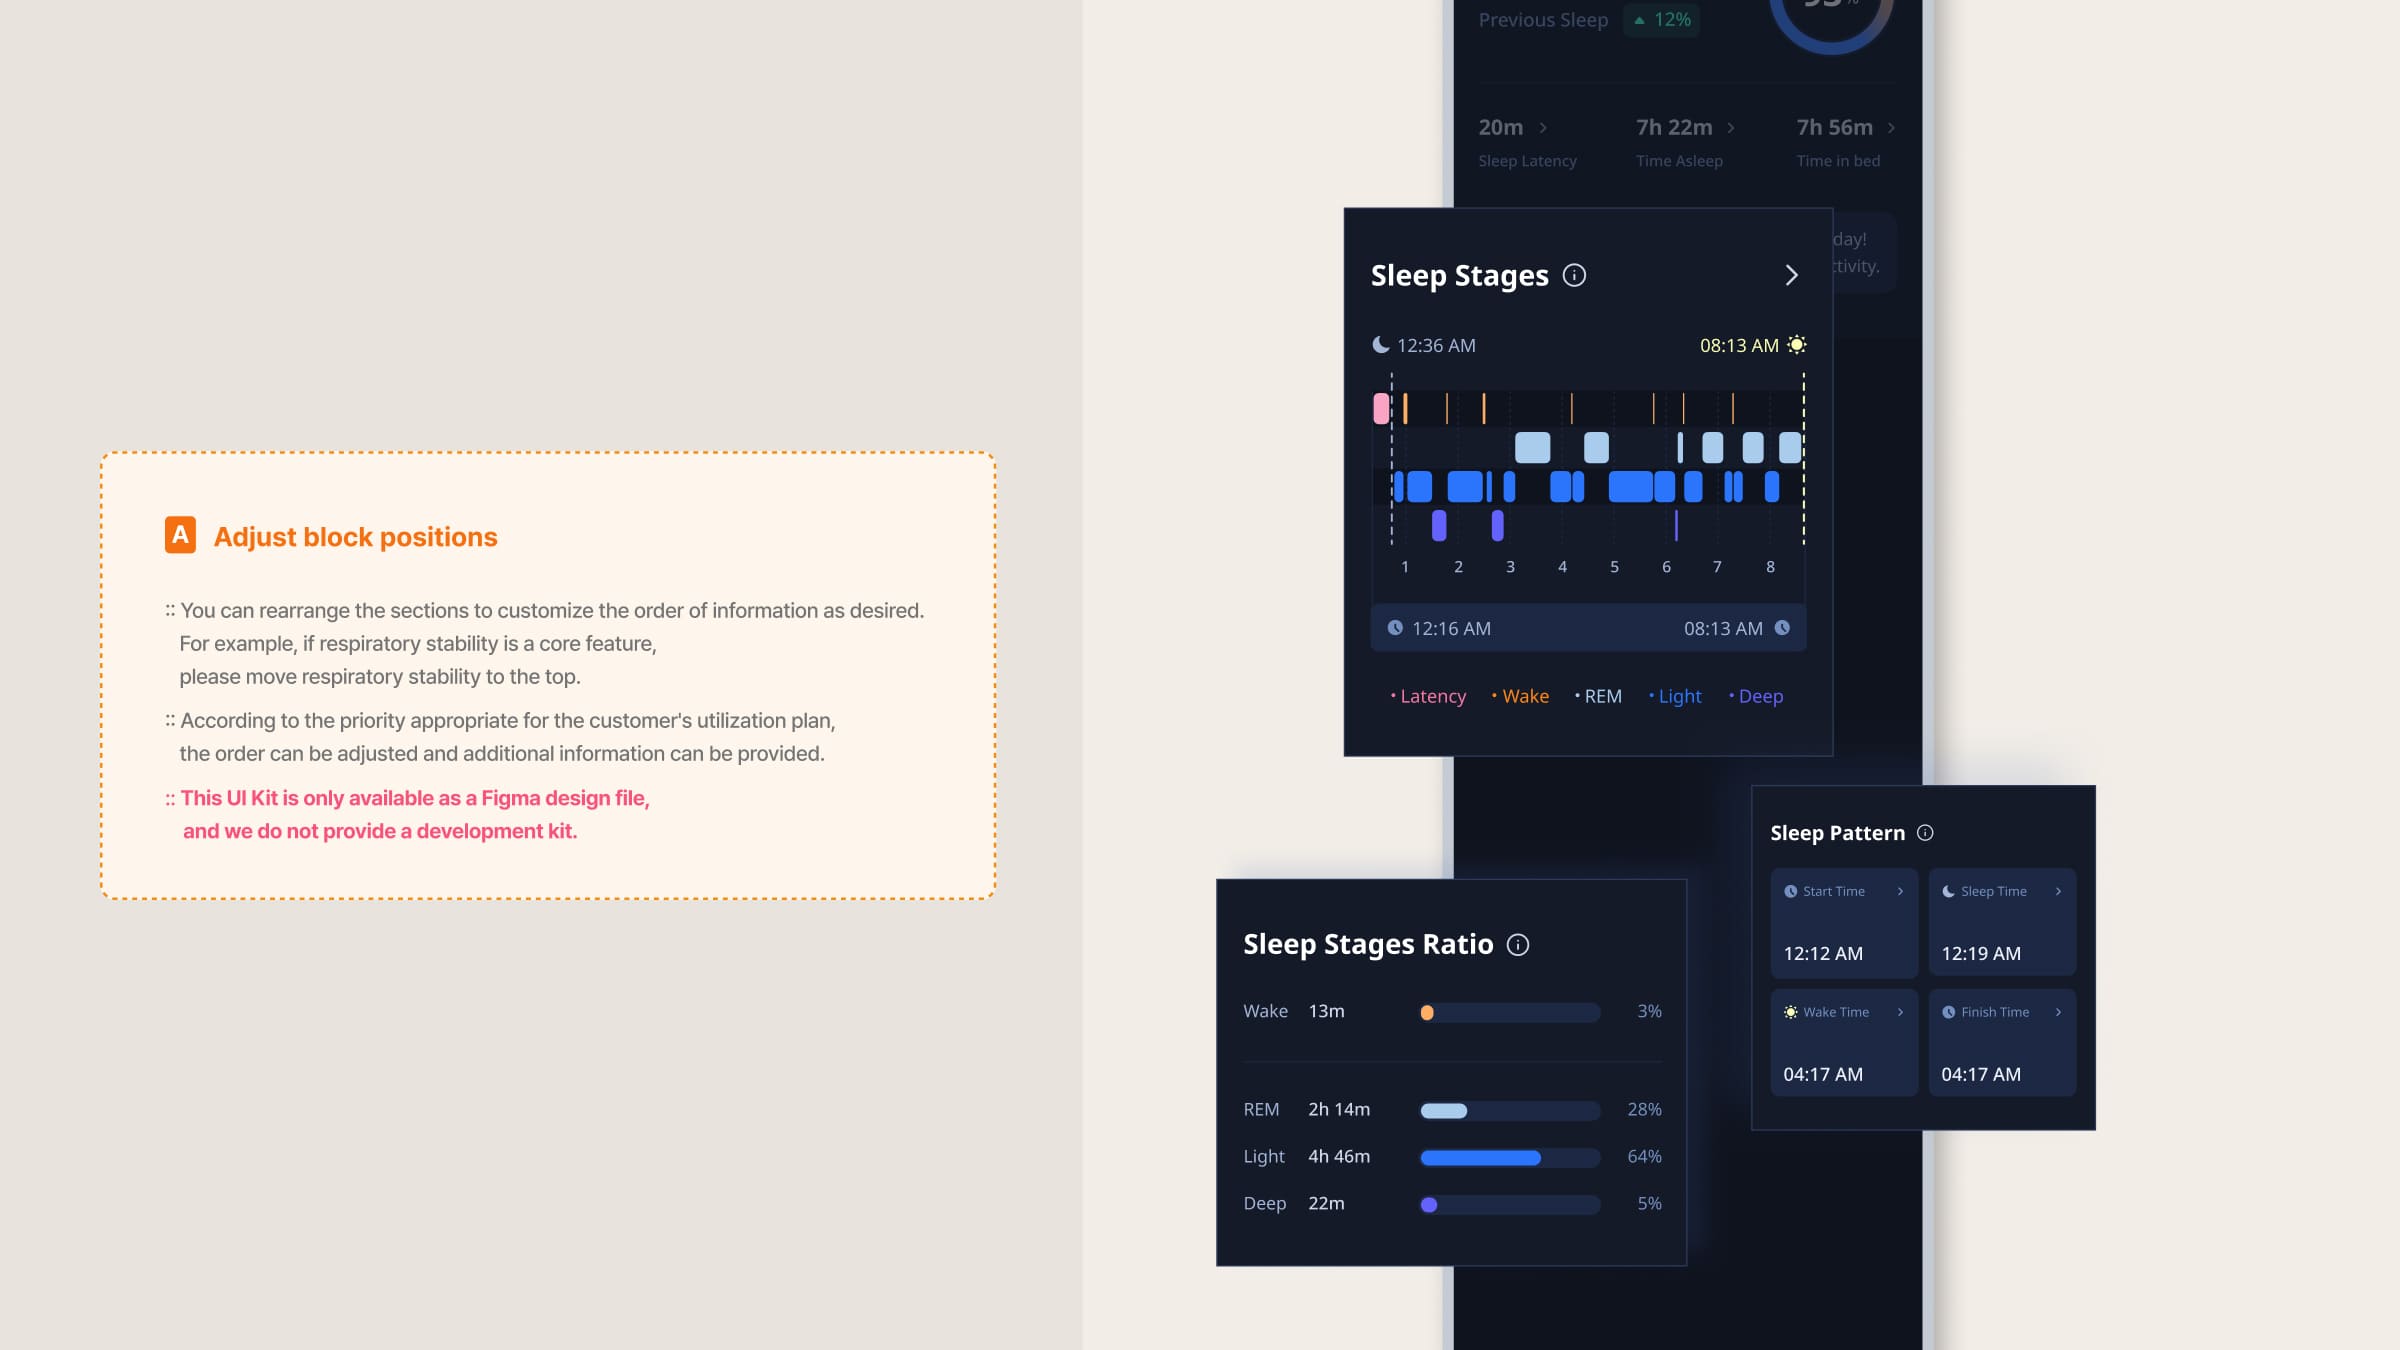
Adjust section priority
You can change the order to adjust the priority of the features according to the core features and concept of your product.
If you're curious about the report design?
If you need design, please request the user guide through the 'inquiry' below:)
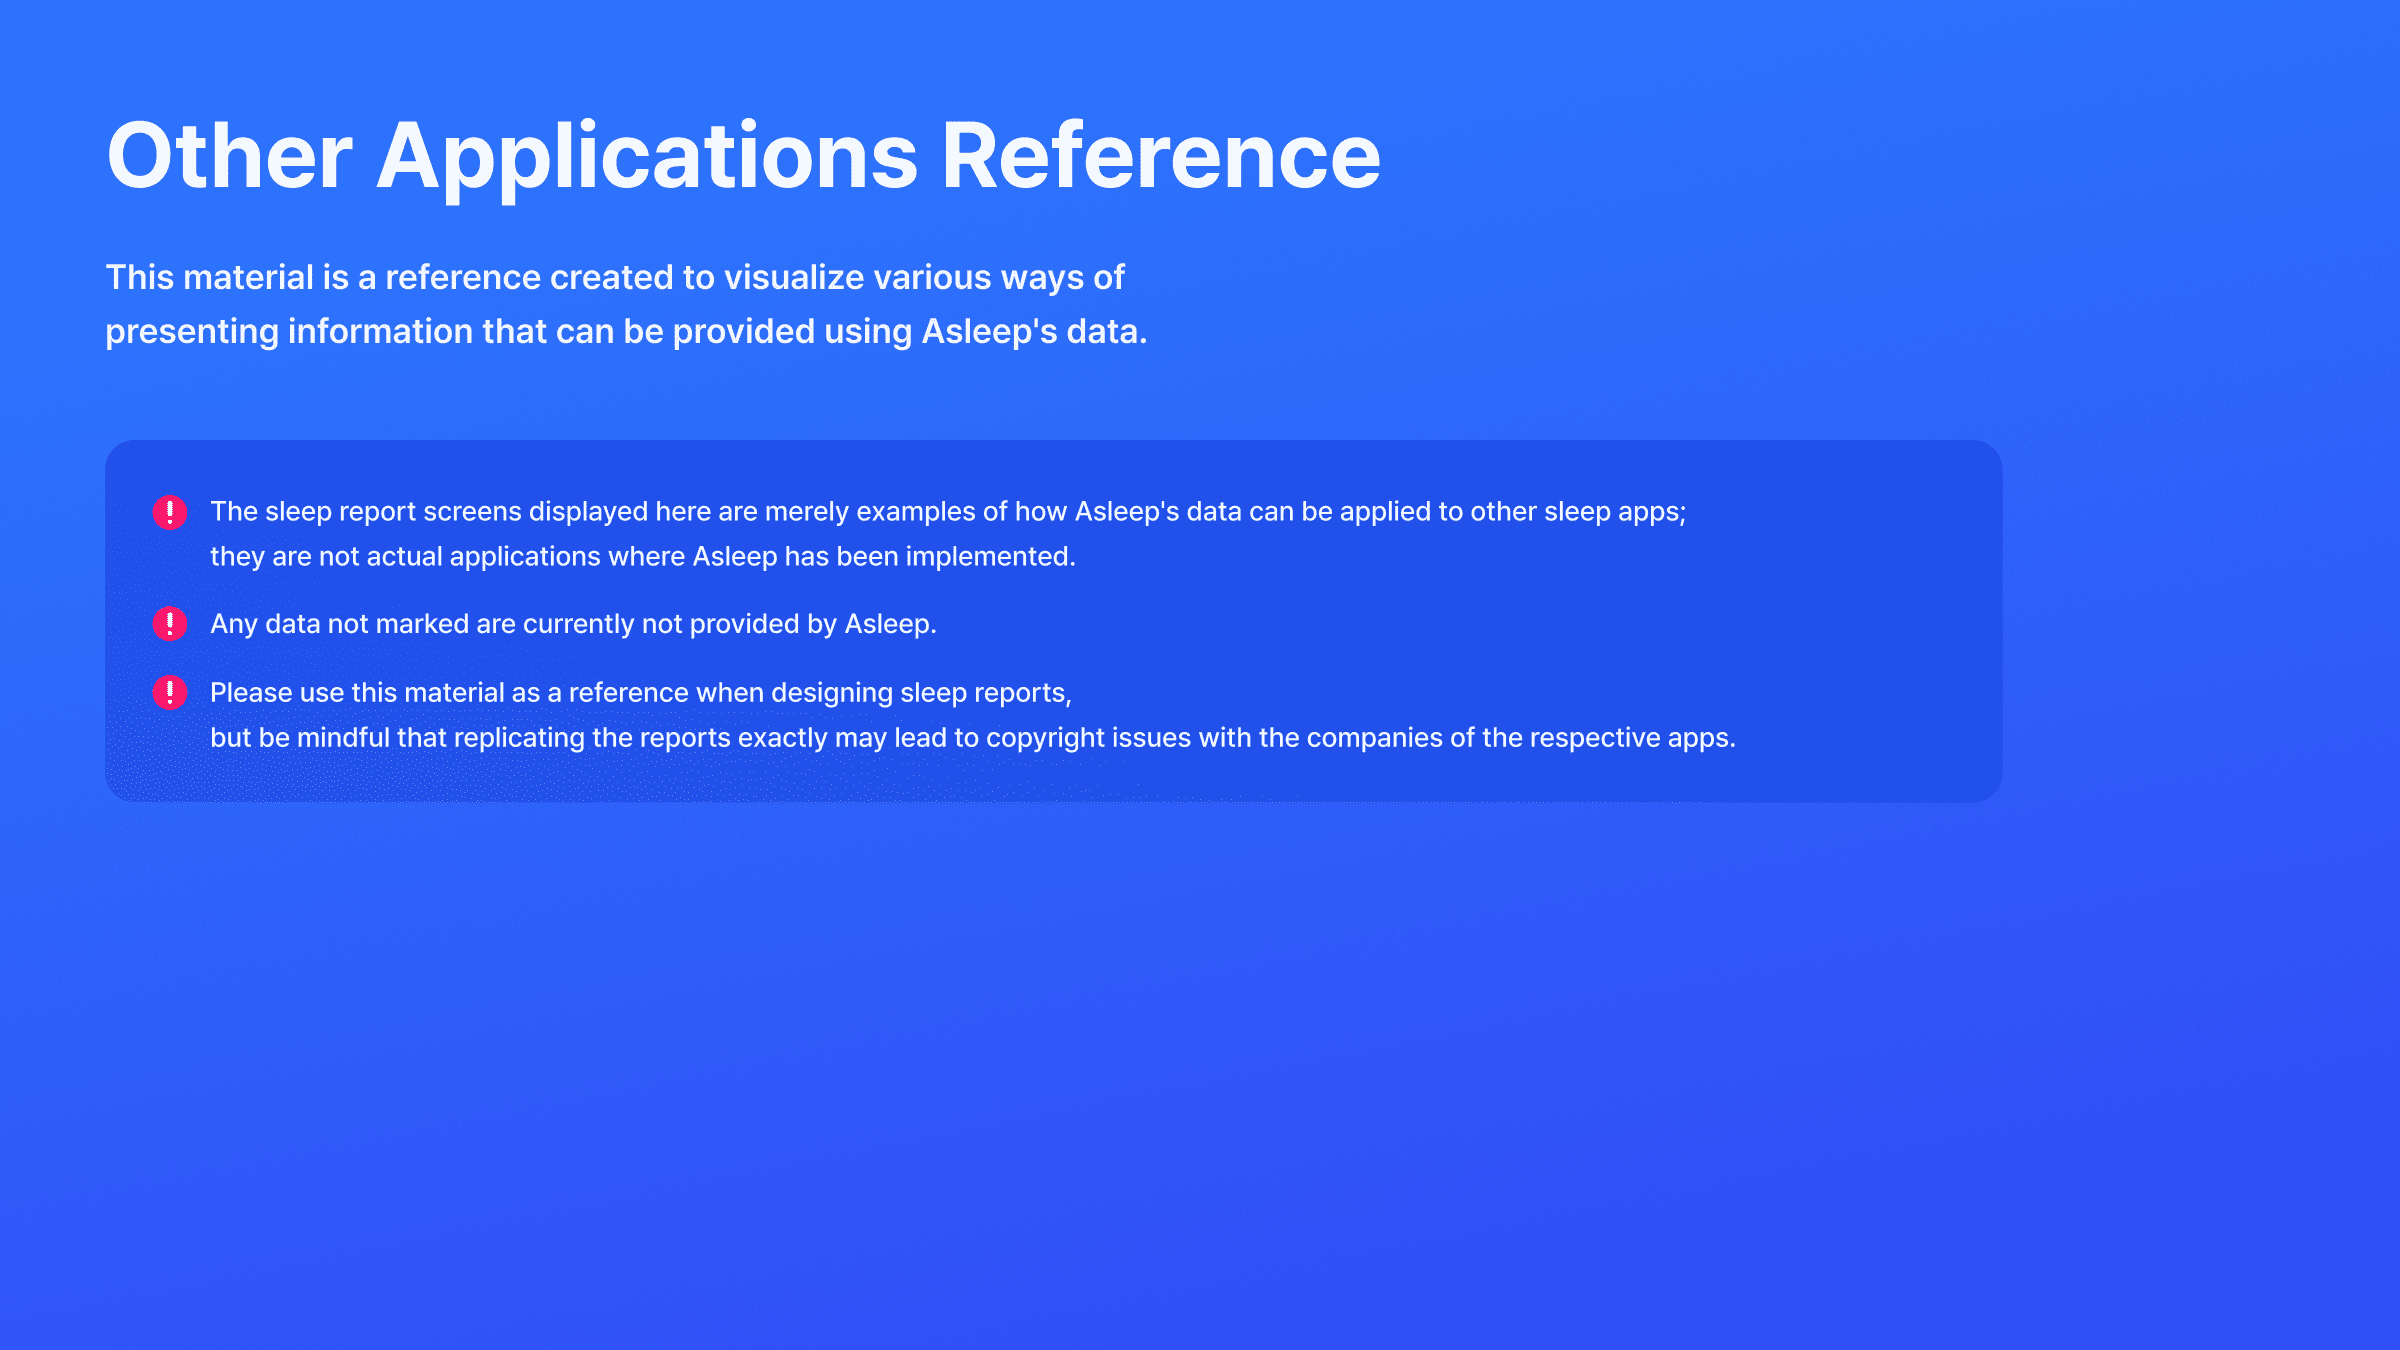
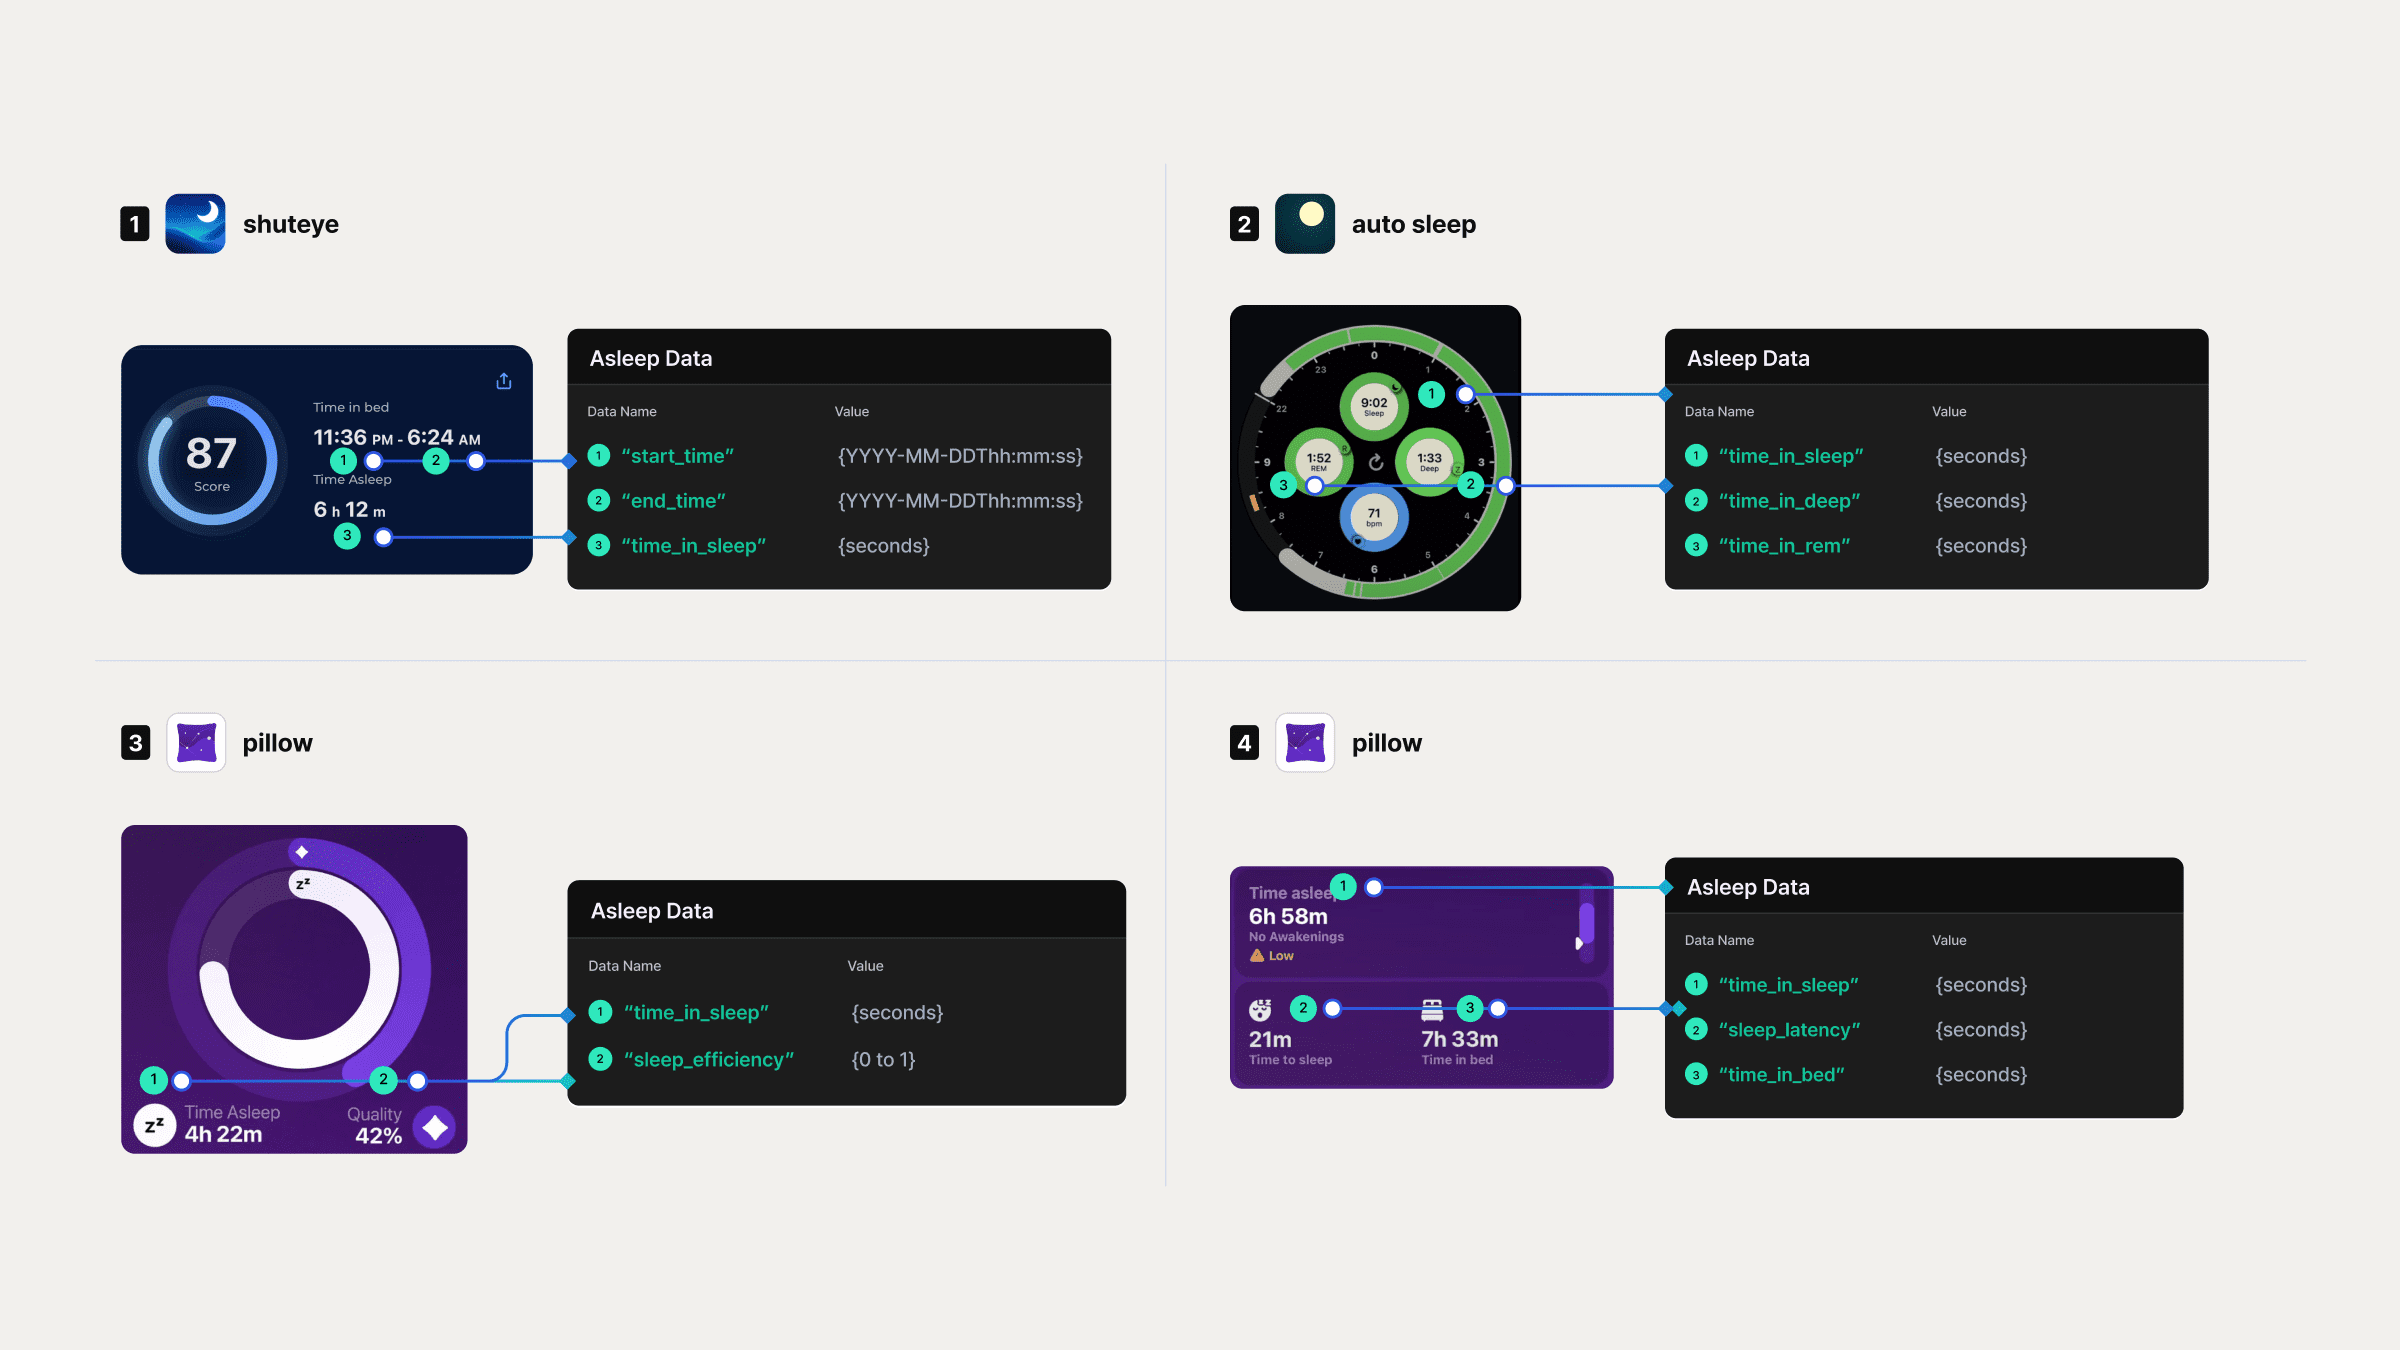
Other Applications Reference
This is a resource that provides guidance on various ways to visualize sleep data using SleepTrack. Utilizing this reference can not only increase your understanding of how to use sleep data with A-Sleep but also save you time when planning and designing sleep reports.