
Analysis
Analysis Tab
Introduction
The "Analysis" tab is a crucial tool for effectively examining the overall sleep data of users and deriving business and marketing insights. In this tab, you can filter data by date ranges to view desired usage and sleep data.
Additionally, you can review the overall sleep data of users based on Sleep Metrics. This allows for an understanding of each user's sleep patterns and trends, and extraction of necessary information. Moreover, through Sleep Reports, you can visually observe numerical changes and detect any anomalies or trends. Such data-driven insights can be invaluable for business decision-making.
Analysis Tab
Filters
You can utilize the filters below to select and view user data based on your desired criteria:
- Date: You can select the time period you wish to view. The default is set to one week, but you can choose from 1 week, 2 weeks, 1 month, or 3 months as needed.
- Environment: You can differentiate and view data from the Test and Live environments.
- API Key: If you are using multiple API keys, you can either view data combined from all keys or view data for each key separately.
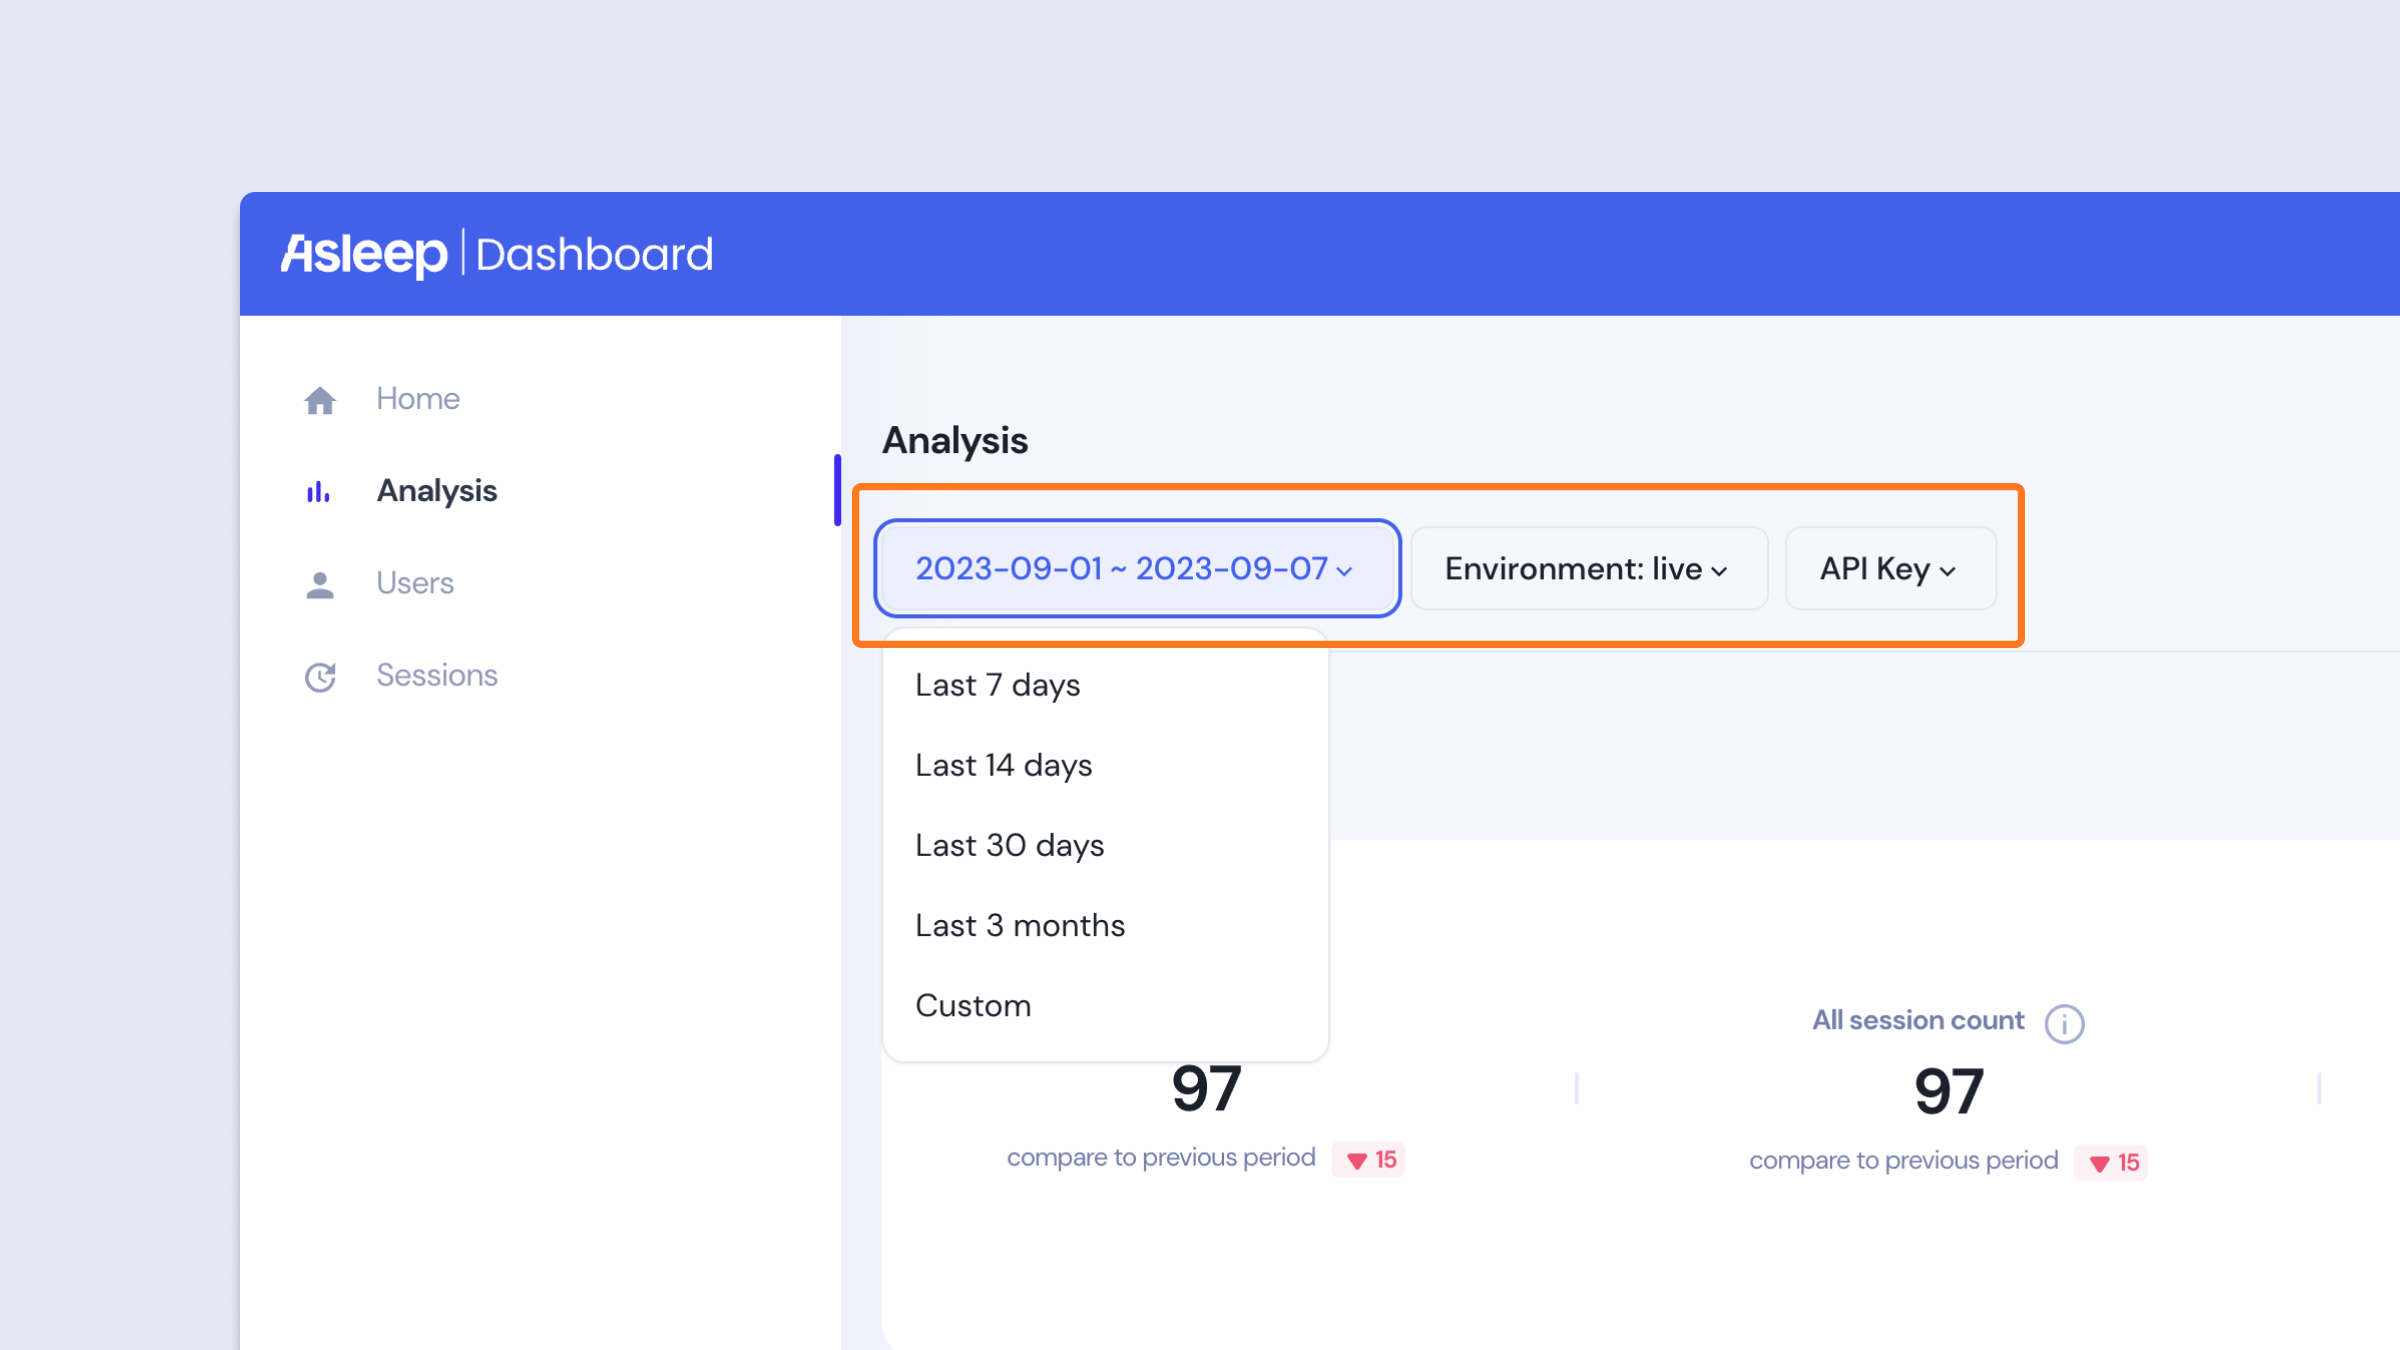
Analysis Filters
Time Zone
You can change the time zone applied to the dashboard. Currently, we support two time zones: Seoul and UTC.
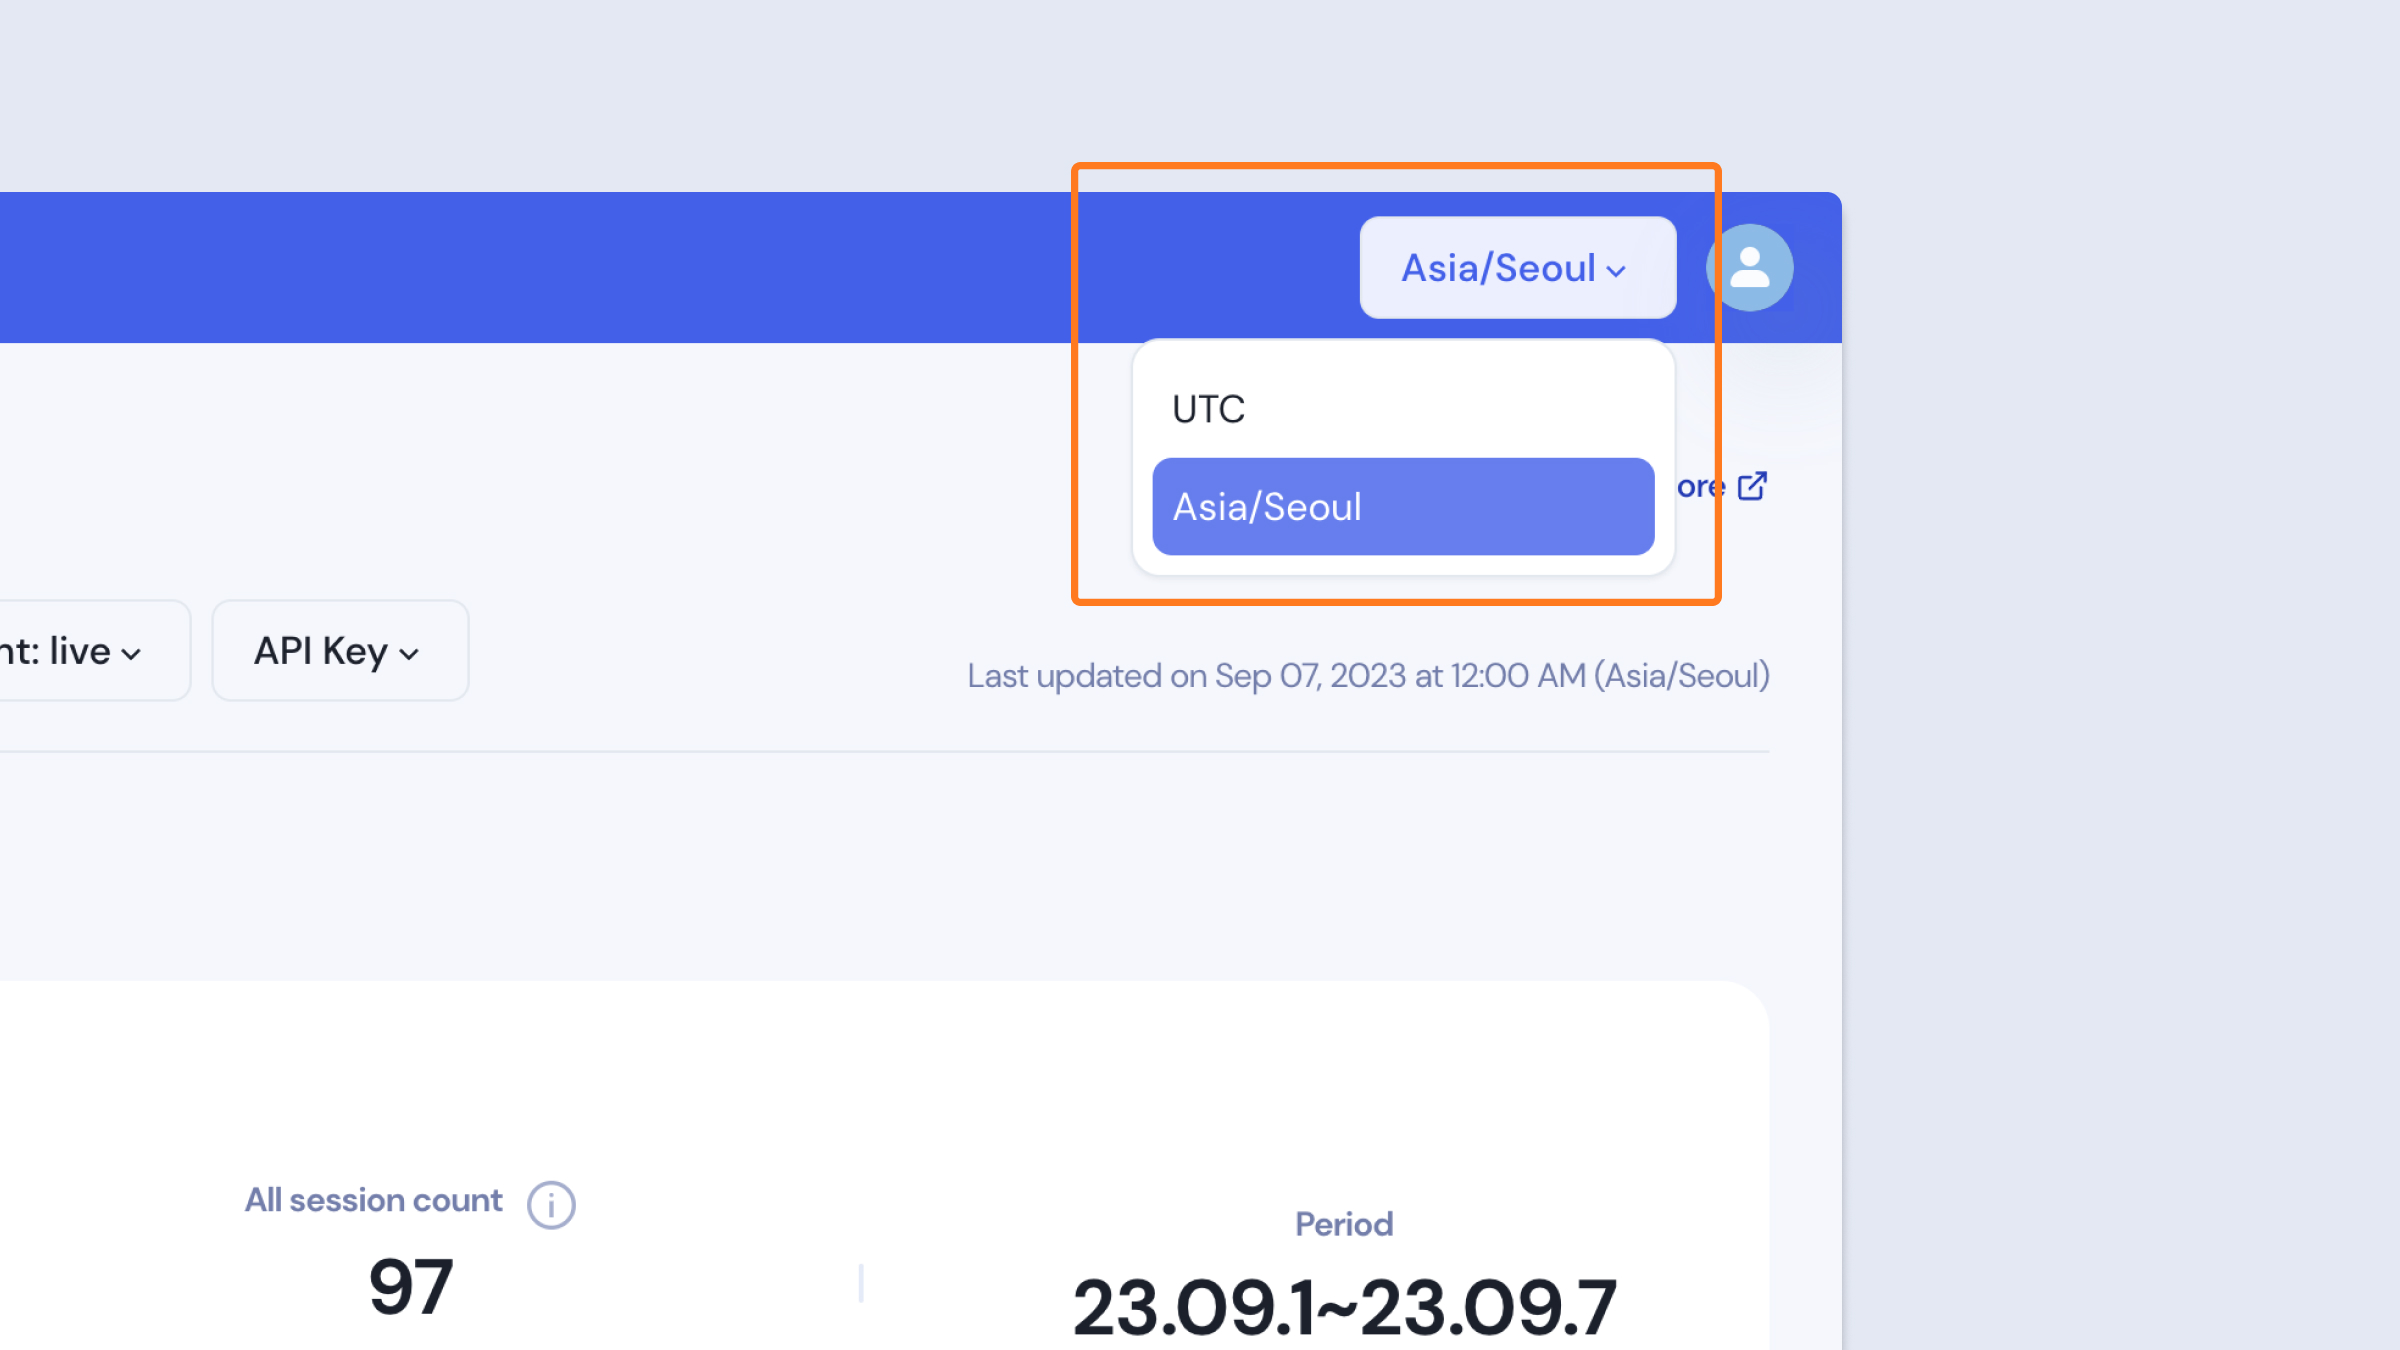
Dashboard Timezone
Update Frequency
Analysis data is aggregated every hour and updated on the dashboard. You can verify the most recent aggregation time displayed on the dashboard in the upper right corner of the tab.
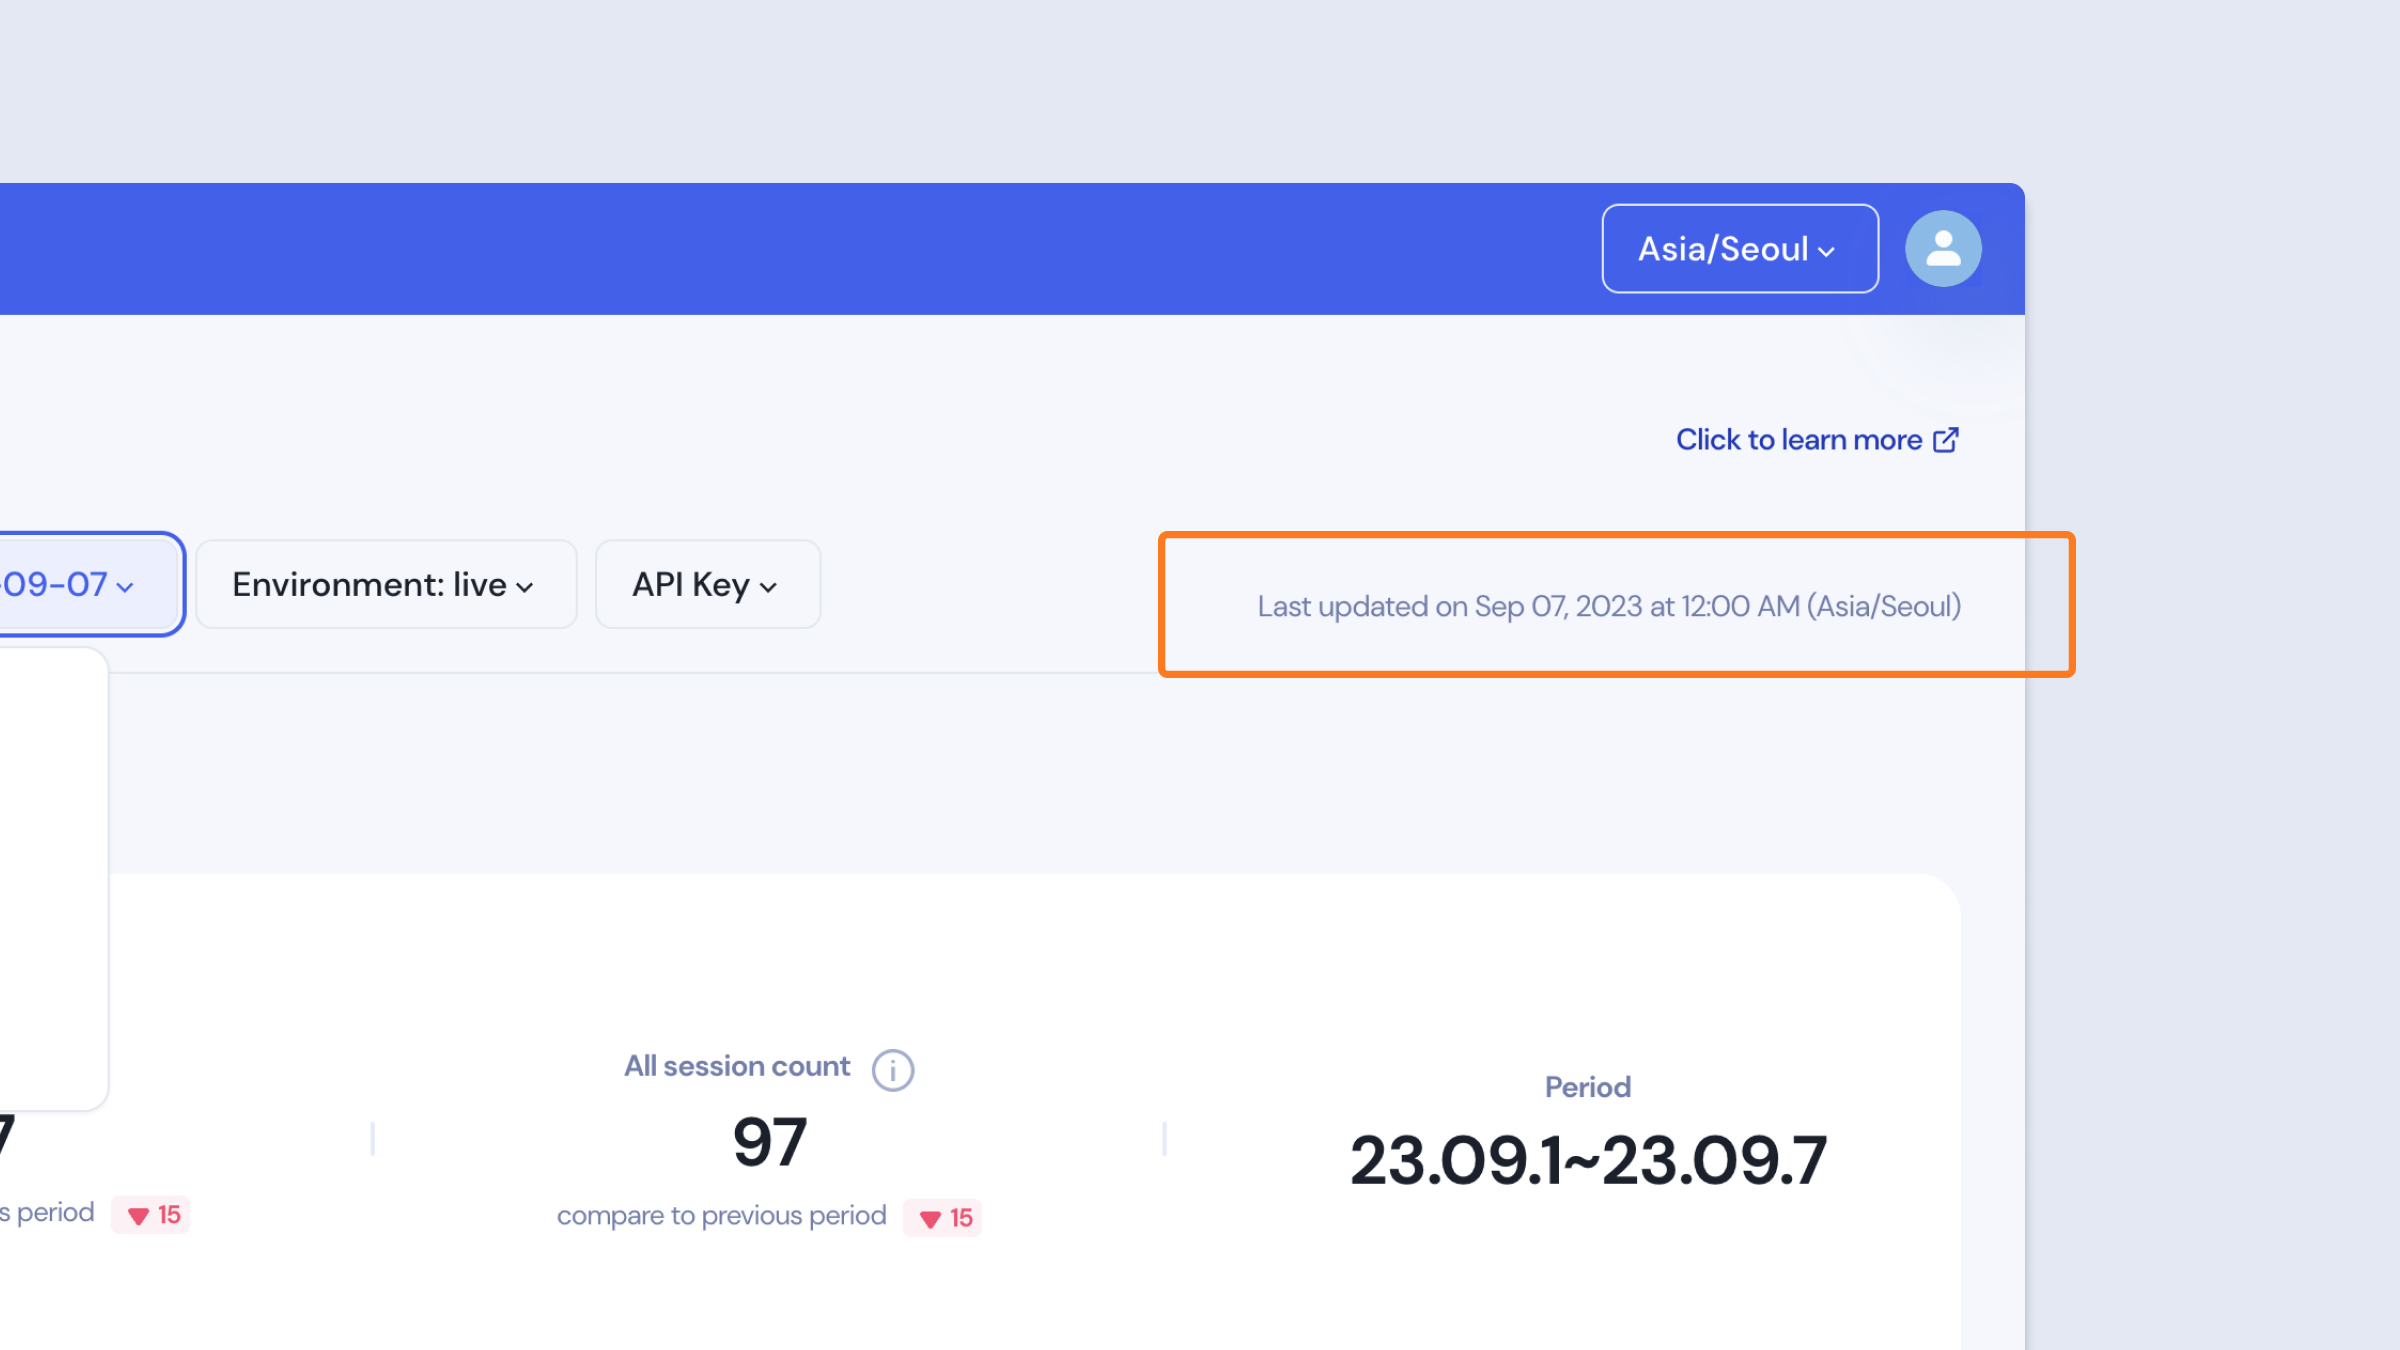
Last Updated Mark
Analysis Charts
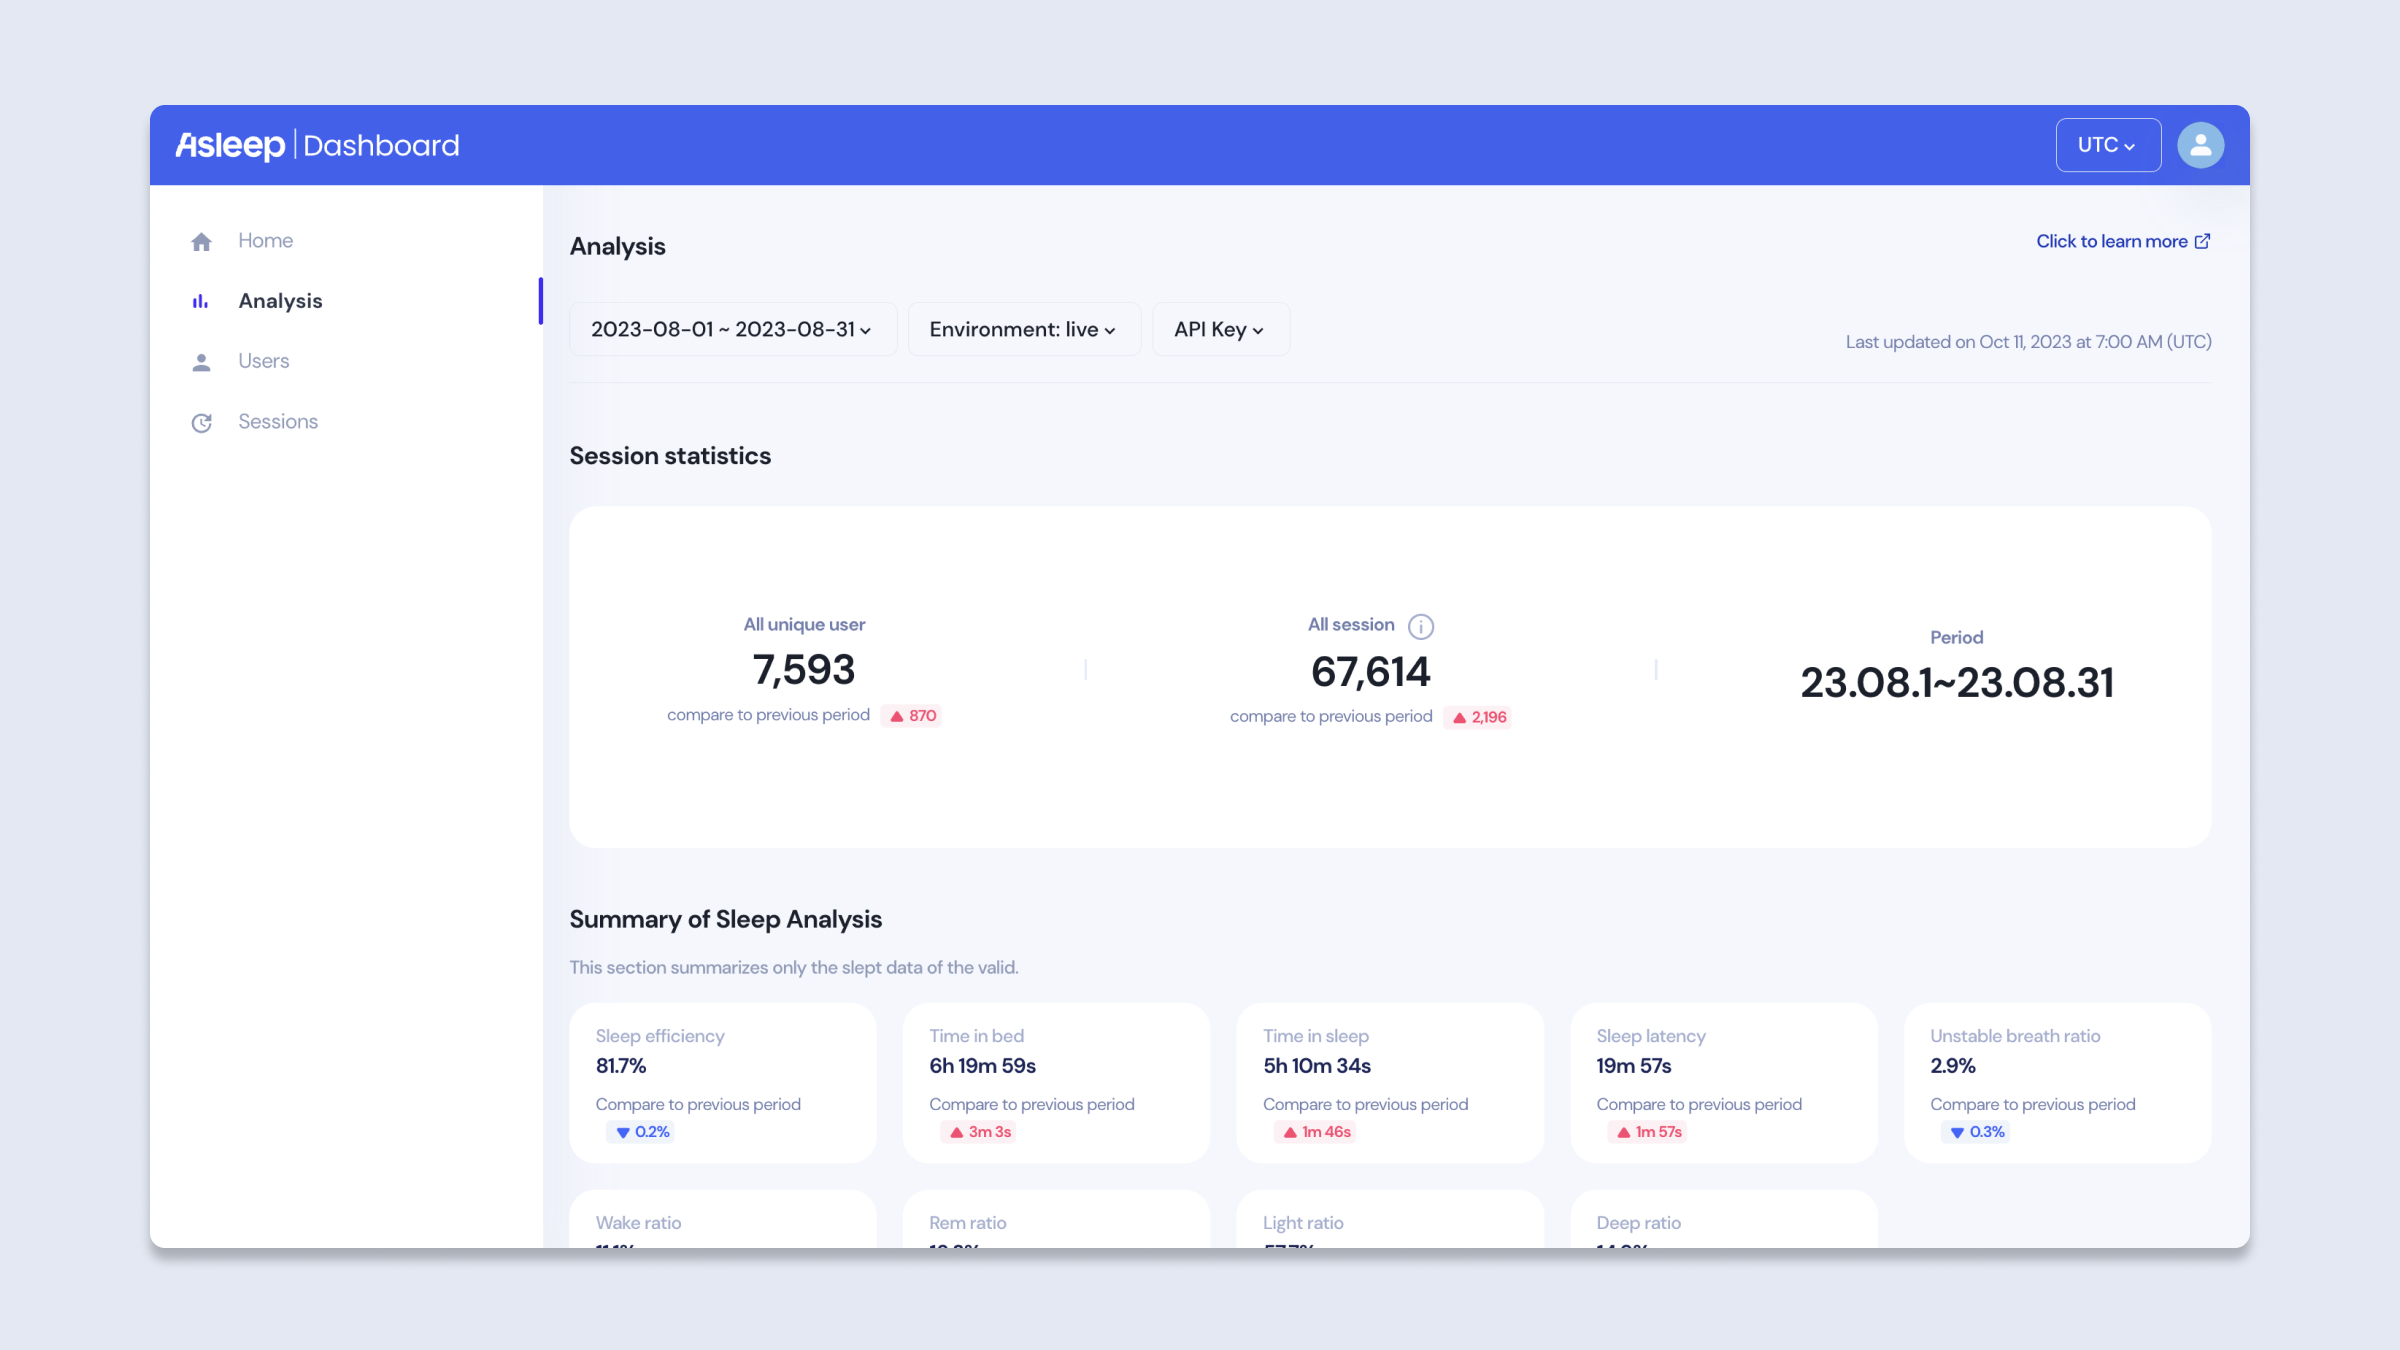
All user statistics
- All user count: This represents the total number of distinct users who utilized the sleep tracking feature during the selected period. Even if a user accessed the sleep tracking multiple times within the chosen timeframe, they are counted only once. This count applies to both valid and invalid session users. You can also see the change in number compared to the previous period.
- All Session Count: Displays the total number of sessions created during the chosen time frame. This figure includes both valid and invalid sessions, and by clicking on the 'info' icon, you can view detailed information about each session. Additionally, you can see the change in number compared to the previous period.
- Valid / Invalid: Sessions are categorized as valid or invalid based on whether the sleep analysis was successfully conducted.
- Slept / Never-slept: Among the valid sessions, they are divided into sessions where the user had a regular sleep and sessions where the user didn't sleep at all.
- Period: The duration set in the filter is displayed.
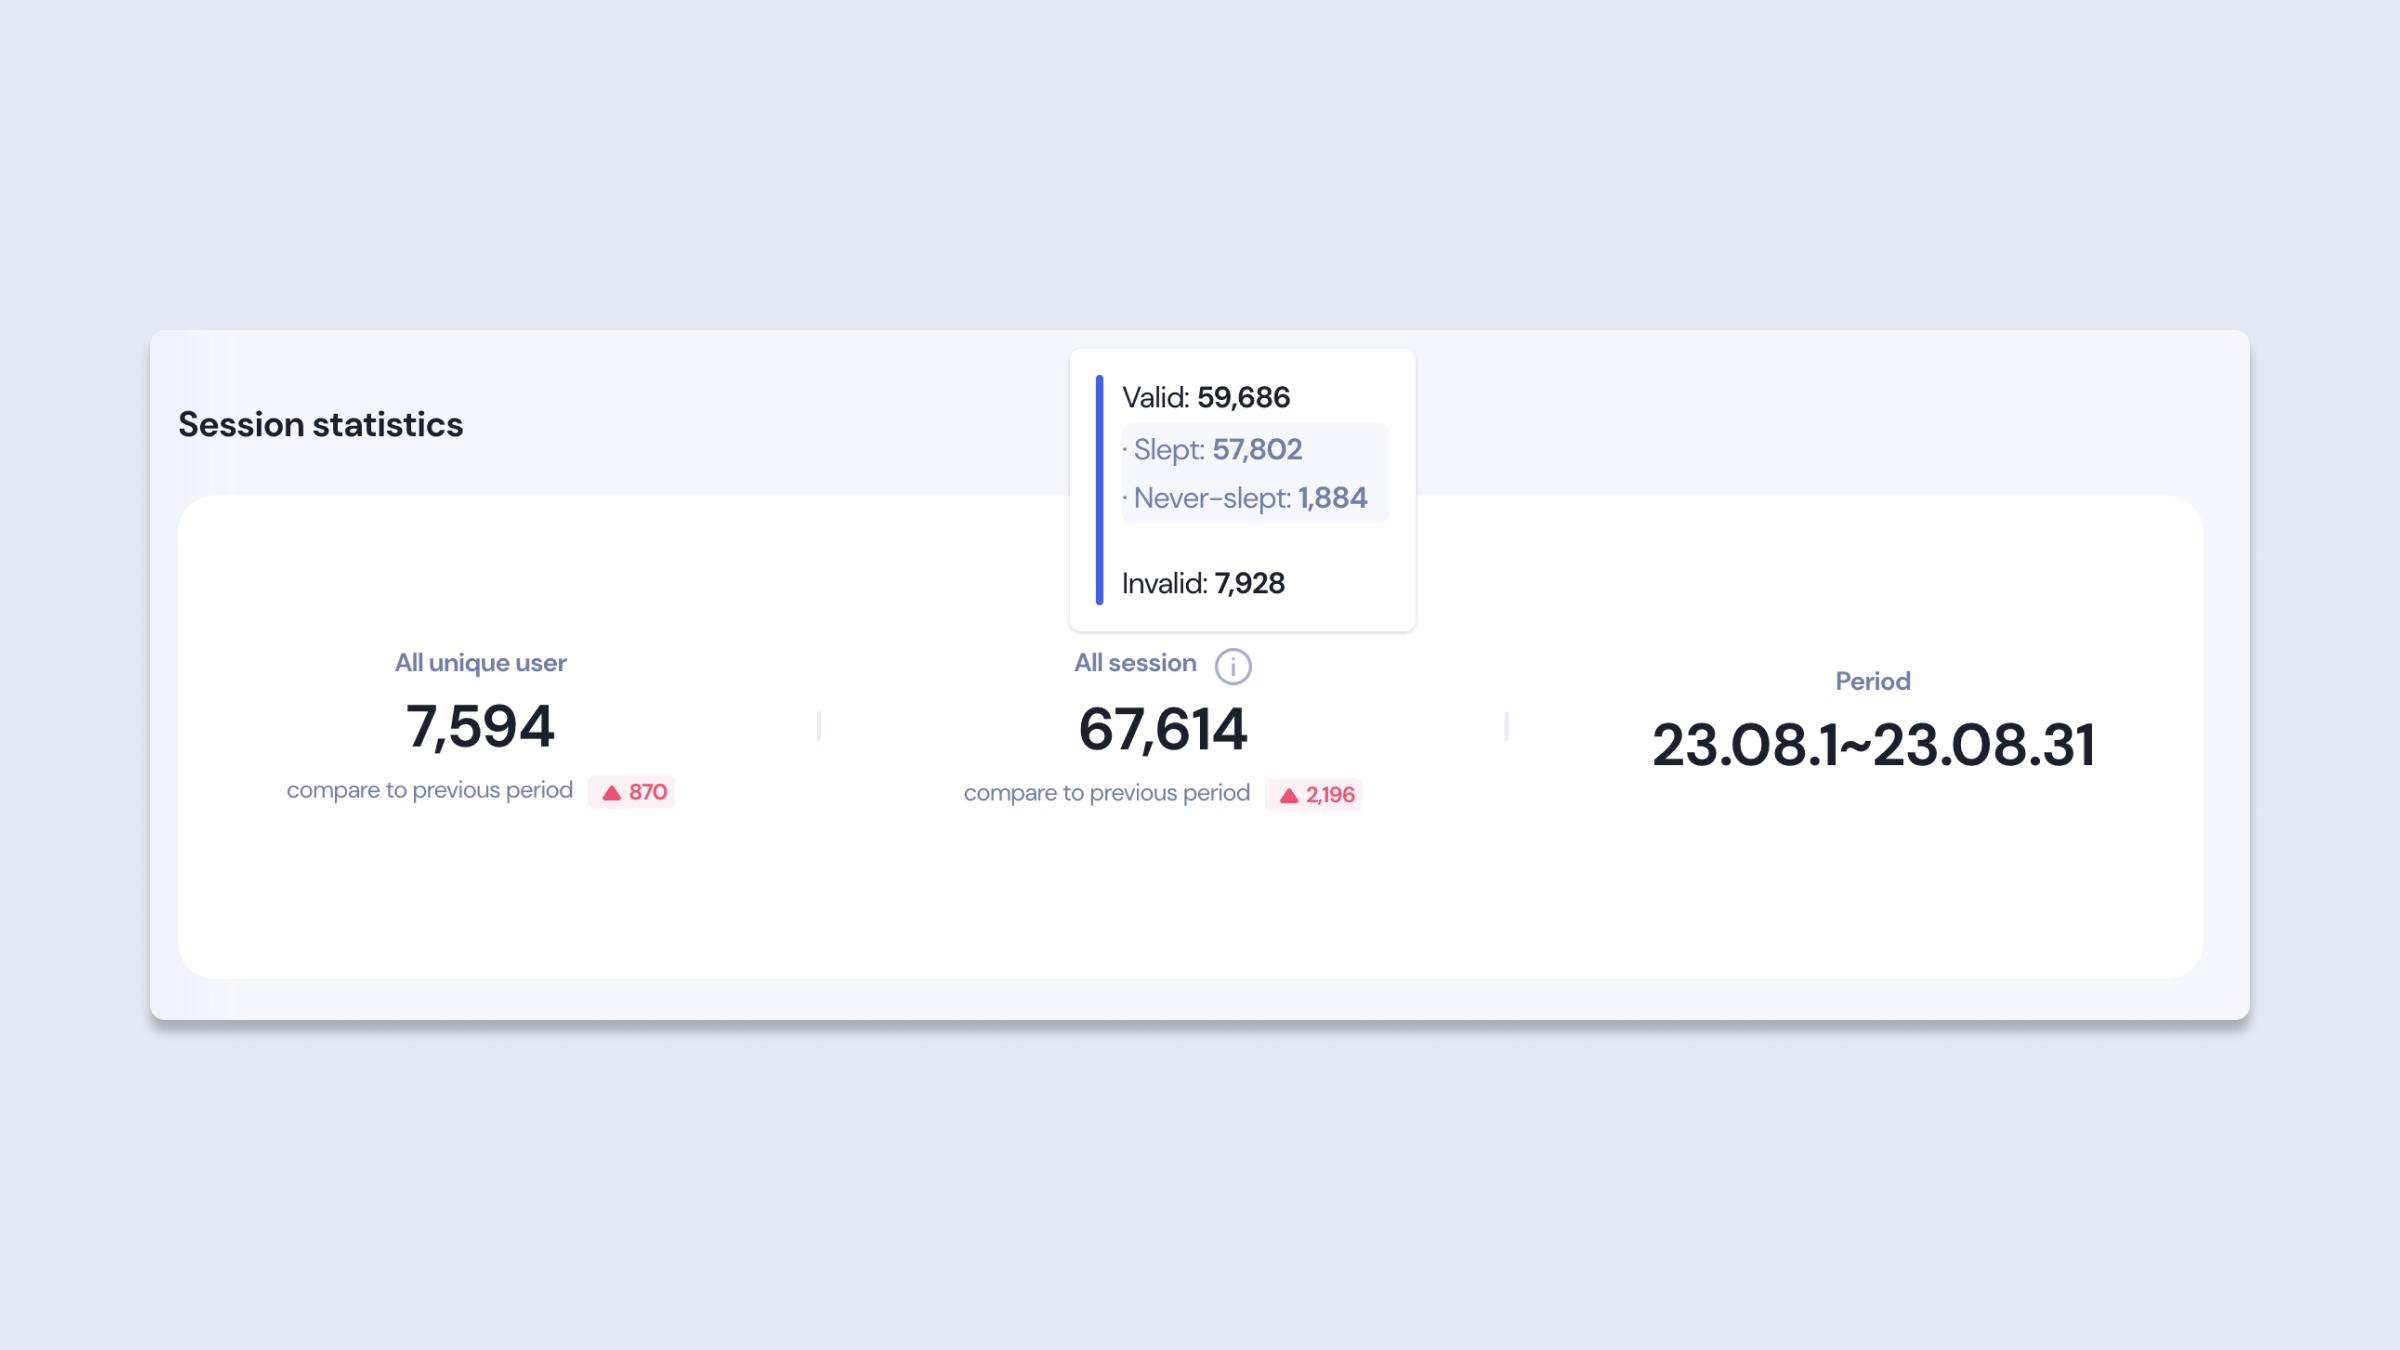
Session statistics
Summary of Sleep Analysis
During the selected period, you can view the average values of critical sleep-related metrics. Sessions in which the 'user did not sleep at all' are excluded from this calculation. Moreover, you can compare the changes in each data point against the previous period. By hovering the mouse over each block, you can see an additional description explaining the significance of each metric.
- Sleep efficiency: Represents the average proportion of 'actual sleep time within the sleep tracking period (from start to finish).'
- Time in bed: Average duration of the sleep tracking period.
- Time in sleep: Average duration of actual sleep.
- Sleep latency: Average time taken to fall asleep after sleep tracking begins.
- Wake ratio: Average proportion of time Wake sleep stage.
- REM ratio: Average proportion of REM sleep stage.
- Light ratio: Average proportion of Light sleep stage.
- Deep ratio: Average proportion of Deep sleep stage.
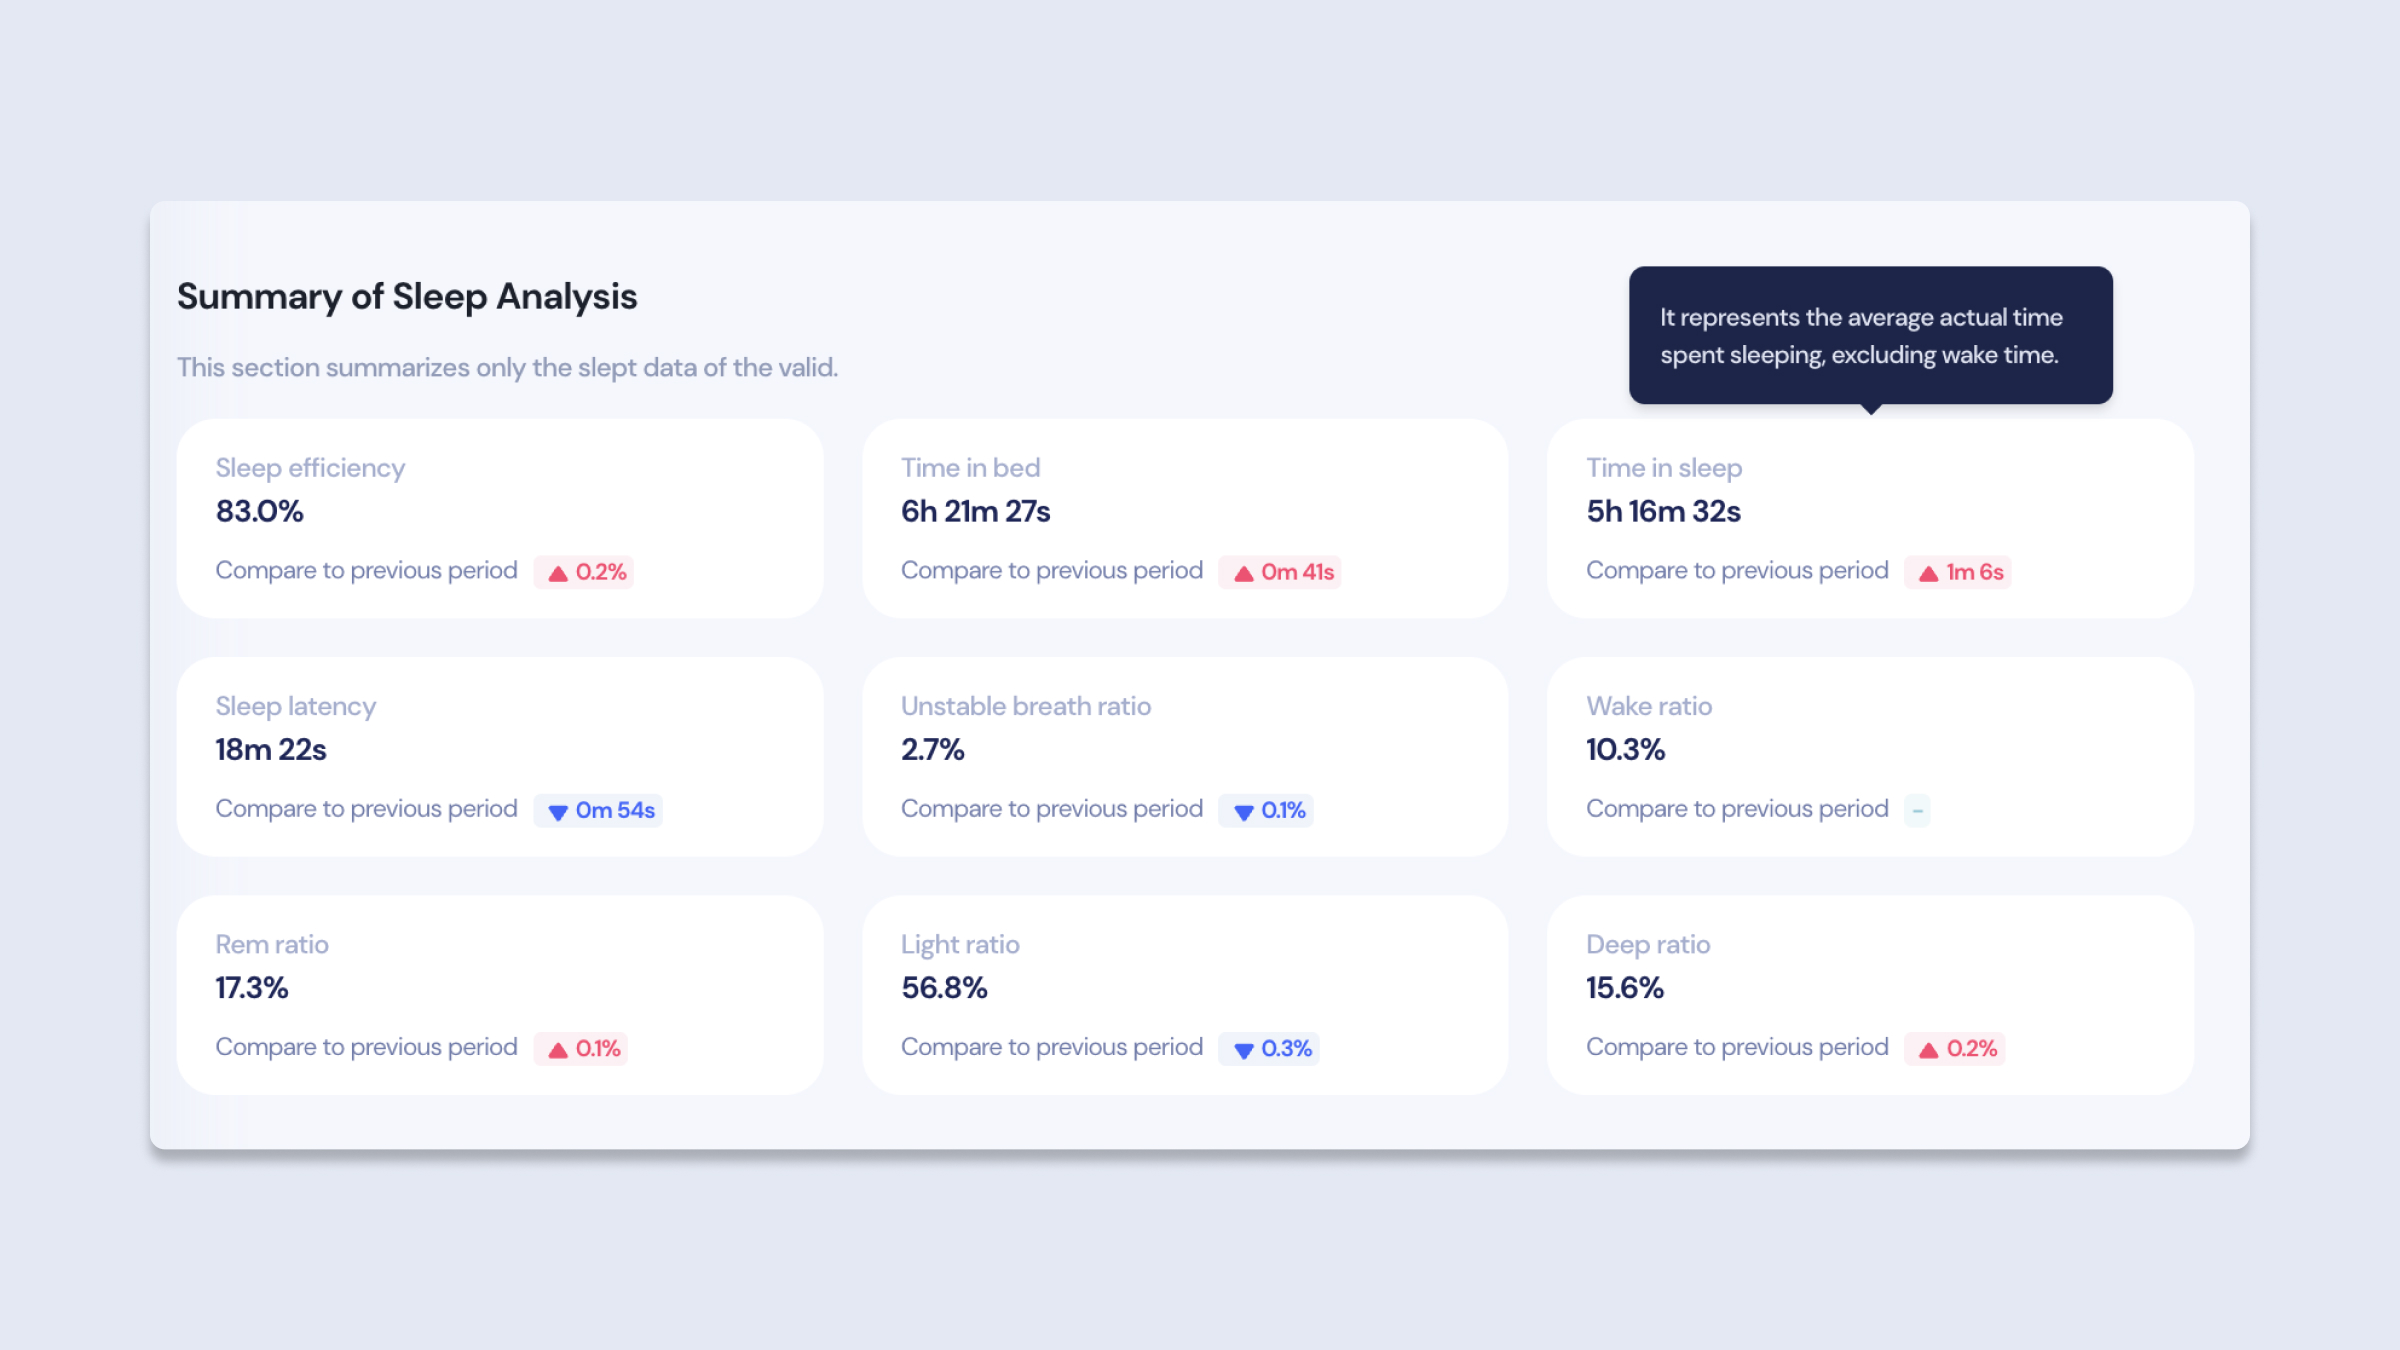
Summary of Sleep Analysis
Sleep Reports
All the sleep trends below can be viewed either daily or weekly. By selecting the weekly view, you can see the average of sessions from Monday to Sunday each week.
Sleep Time
The chart displays the trends in times for starting and ending sleep tracking, as well as the times for falling asleep and waking up.
- Session Start Time: Represents the time when sleep tracking began.
- Sleep Time: Refers to the time when the user started to fall asleep.
- Wake Time: Denotes the time when the user woke up from sleep.
- Session End Time: Indicates the time when the sleep tracking ended.
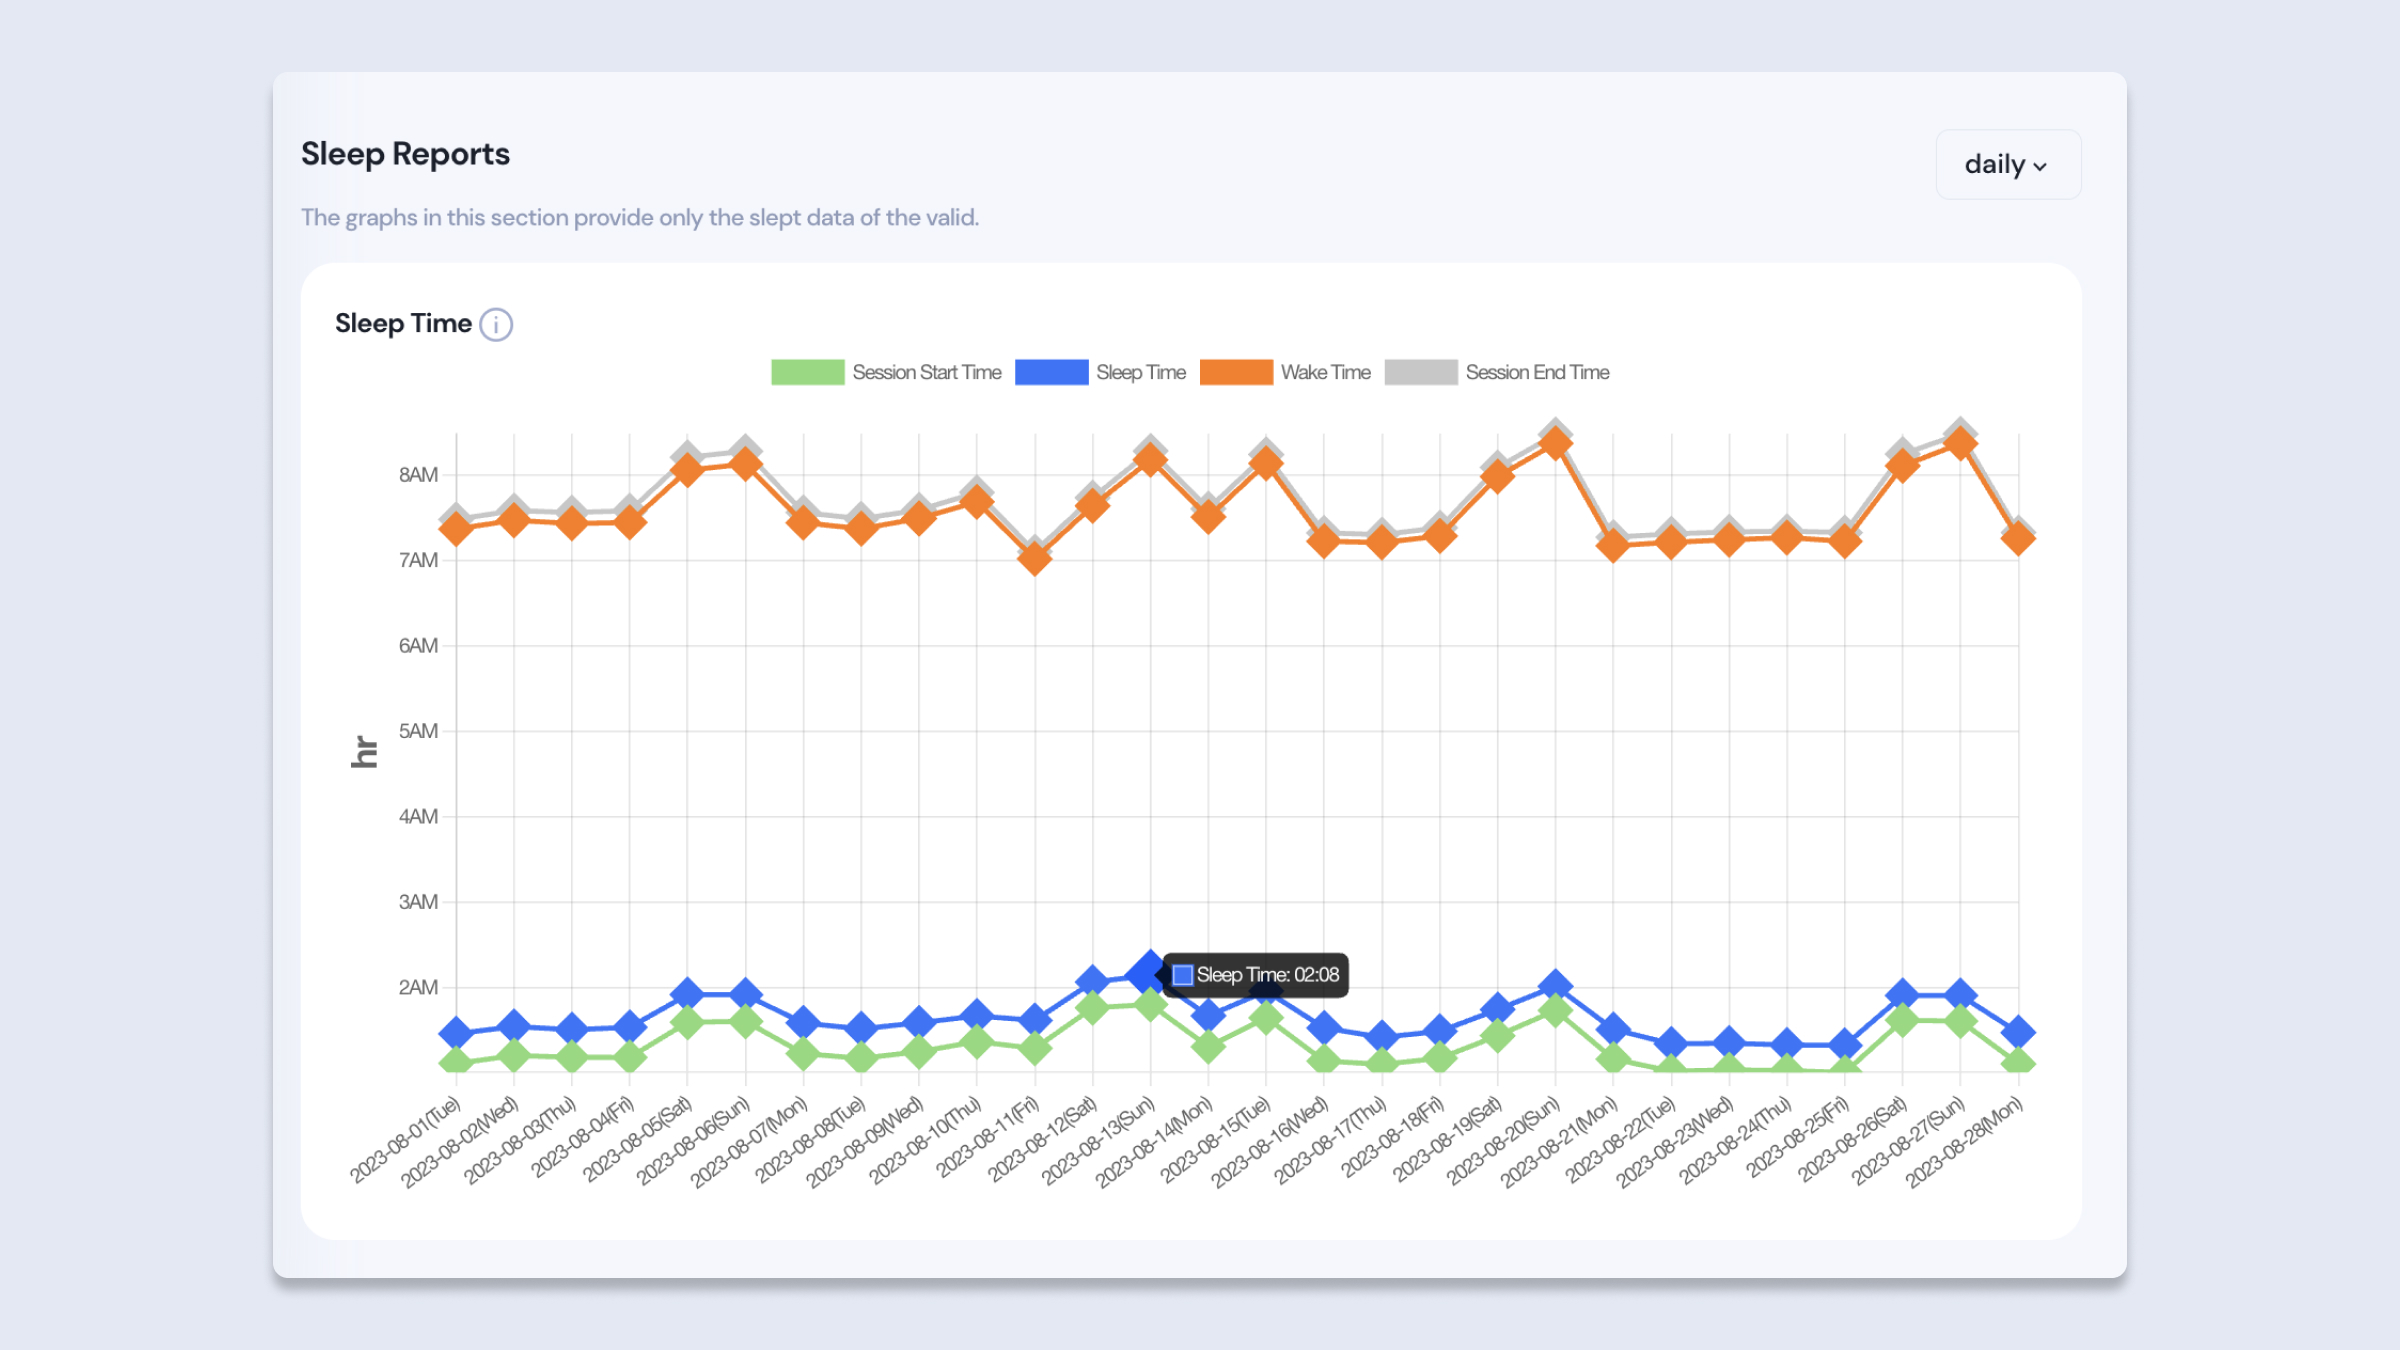
Sleep Reports - Sleep Time
- The Y-axis represents the absolute value, and the X-axis denotes the date.
Sleep Duration
The chart showcases the trends in the duration of sleep tracking and the actual time spent sleeping.
- Time in Sleep: Represents the actual time spent sleeping during the sleep tracking period. This does not include the times the user was awake.
- Time in Bed: Refers to the duration from the start to the end of the sleep tracking.
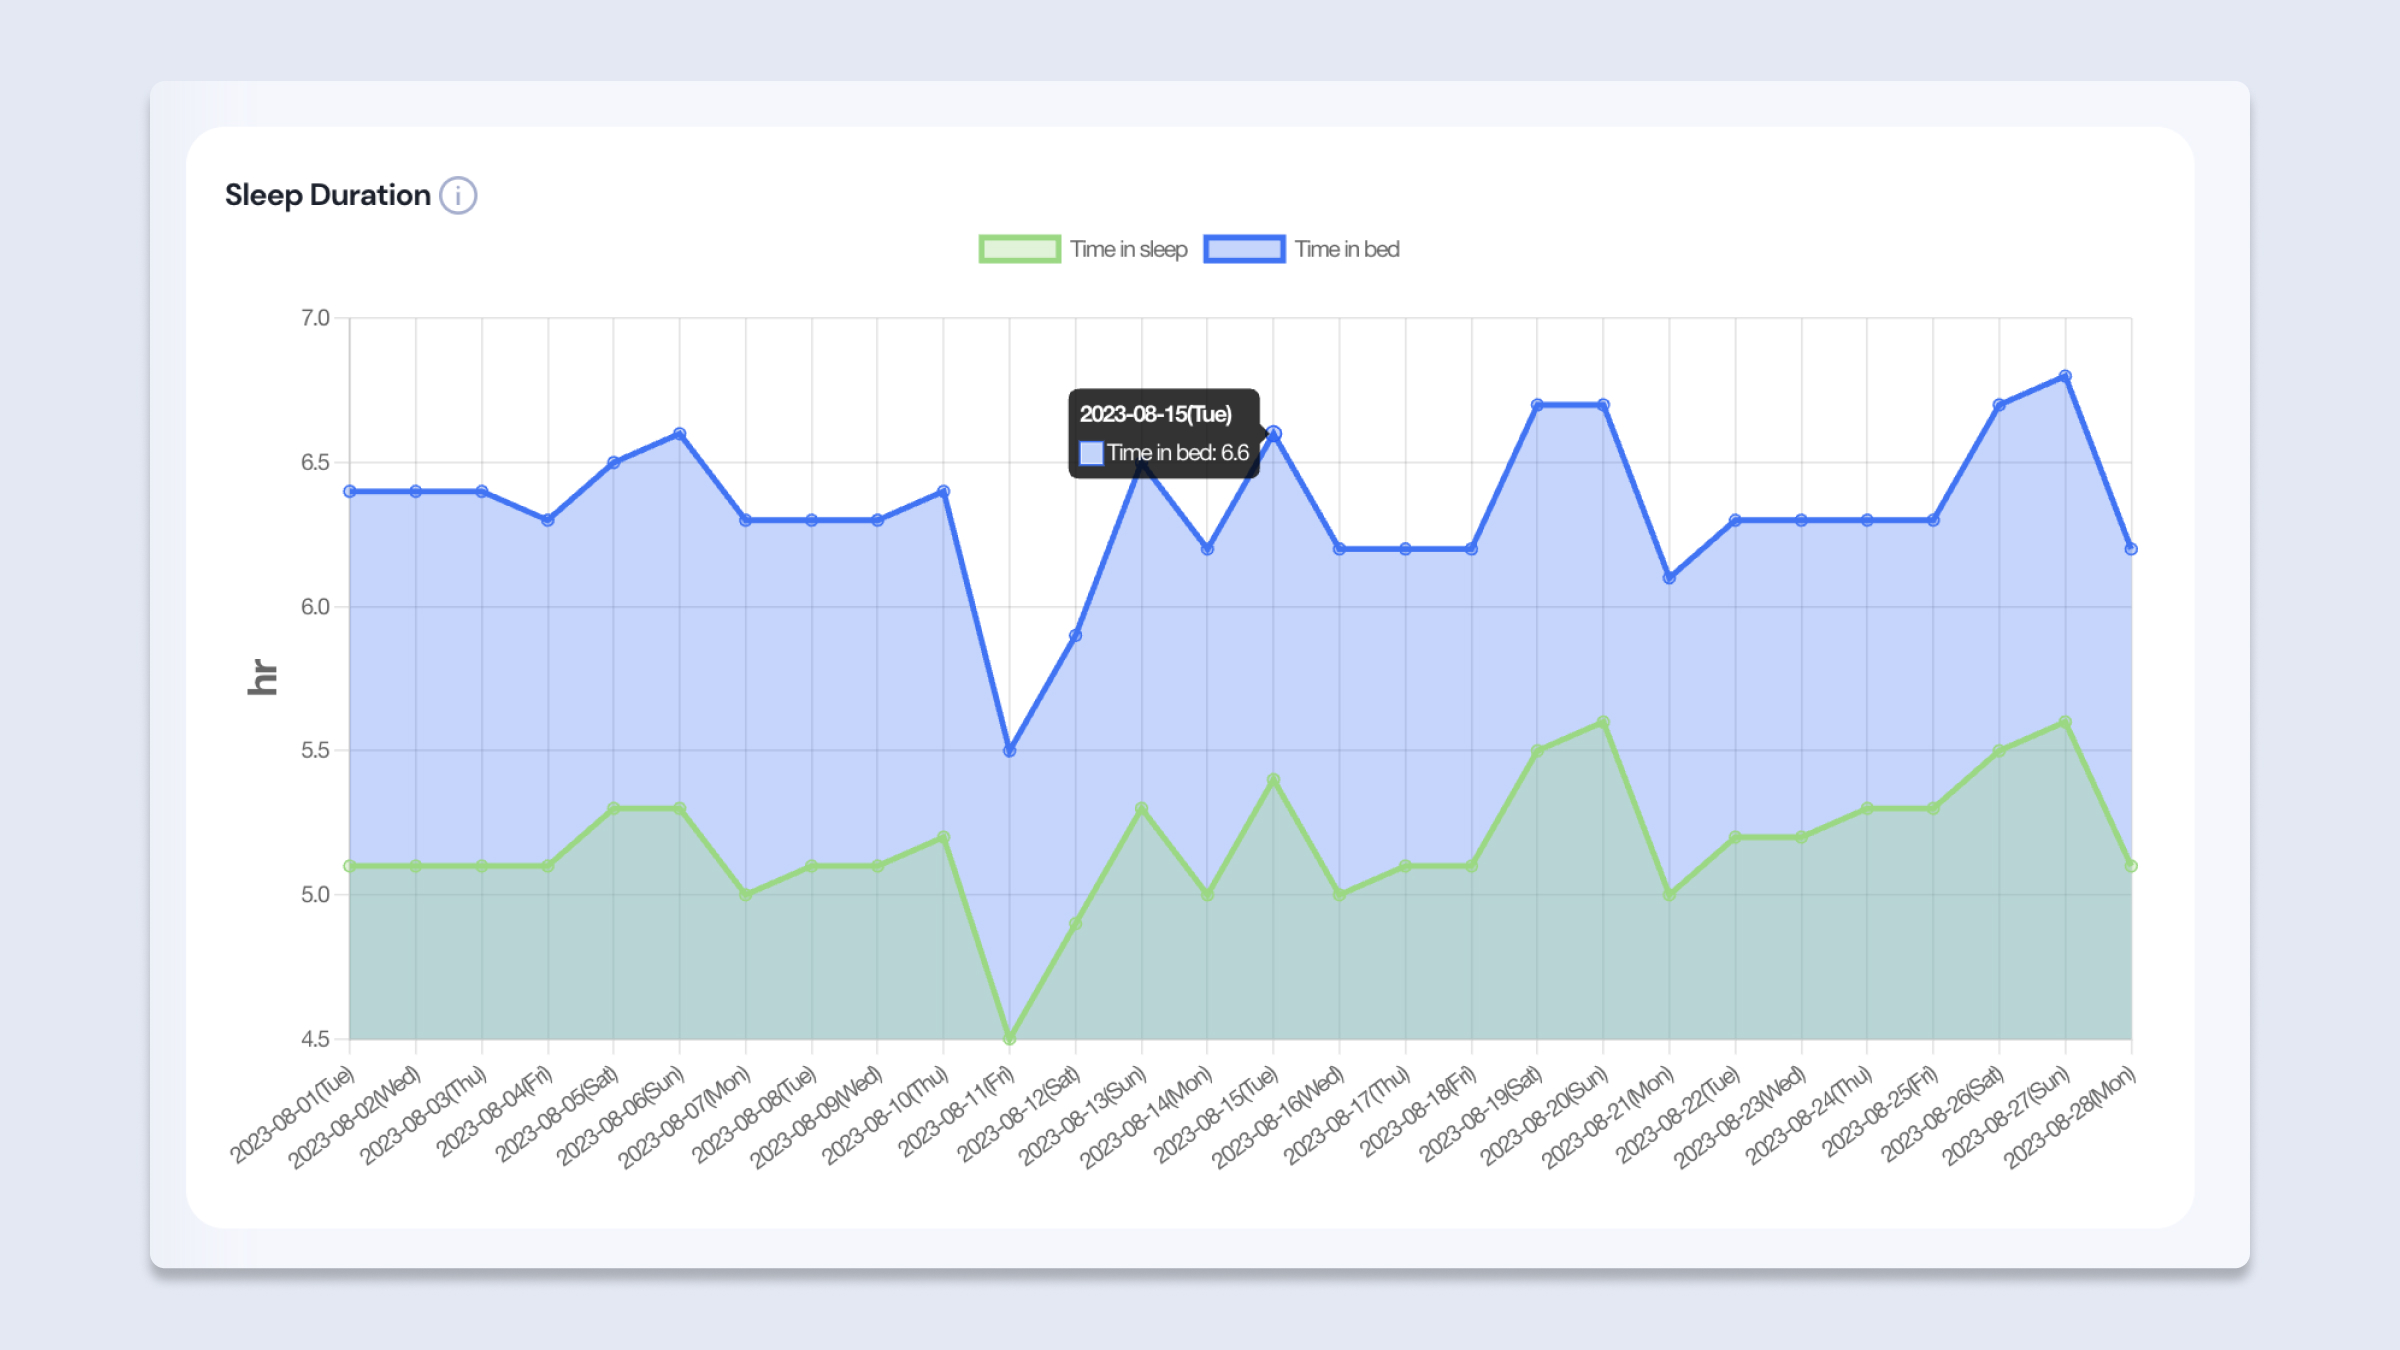
Sleep Reports - Sleep Duration
- The Y-axis represents the absolute value, and the X-axis denotes the date.
Sleep Efficiency
The chart displays the trend in sleep efficiency over time.
- Sleep Efficiency: Refers to the ratio of actual sleeping time during the sleep tracking period.
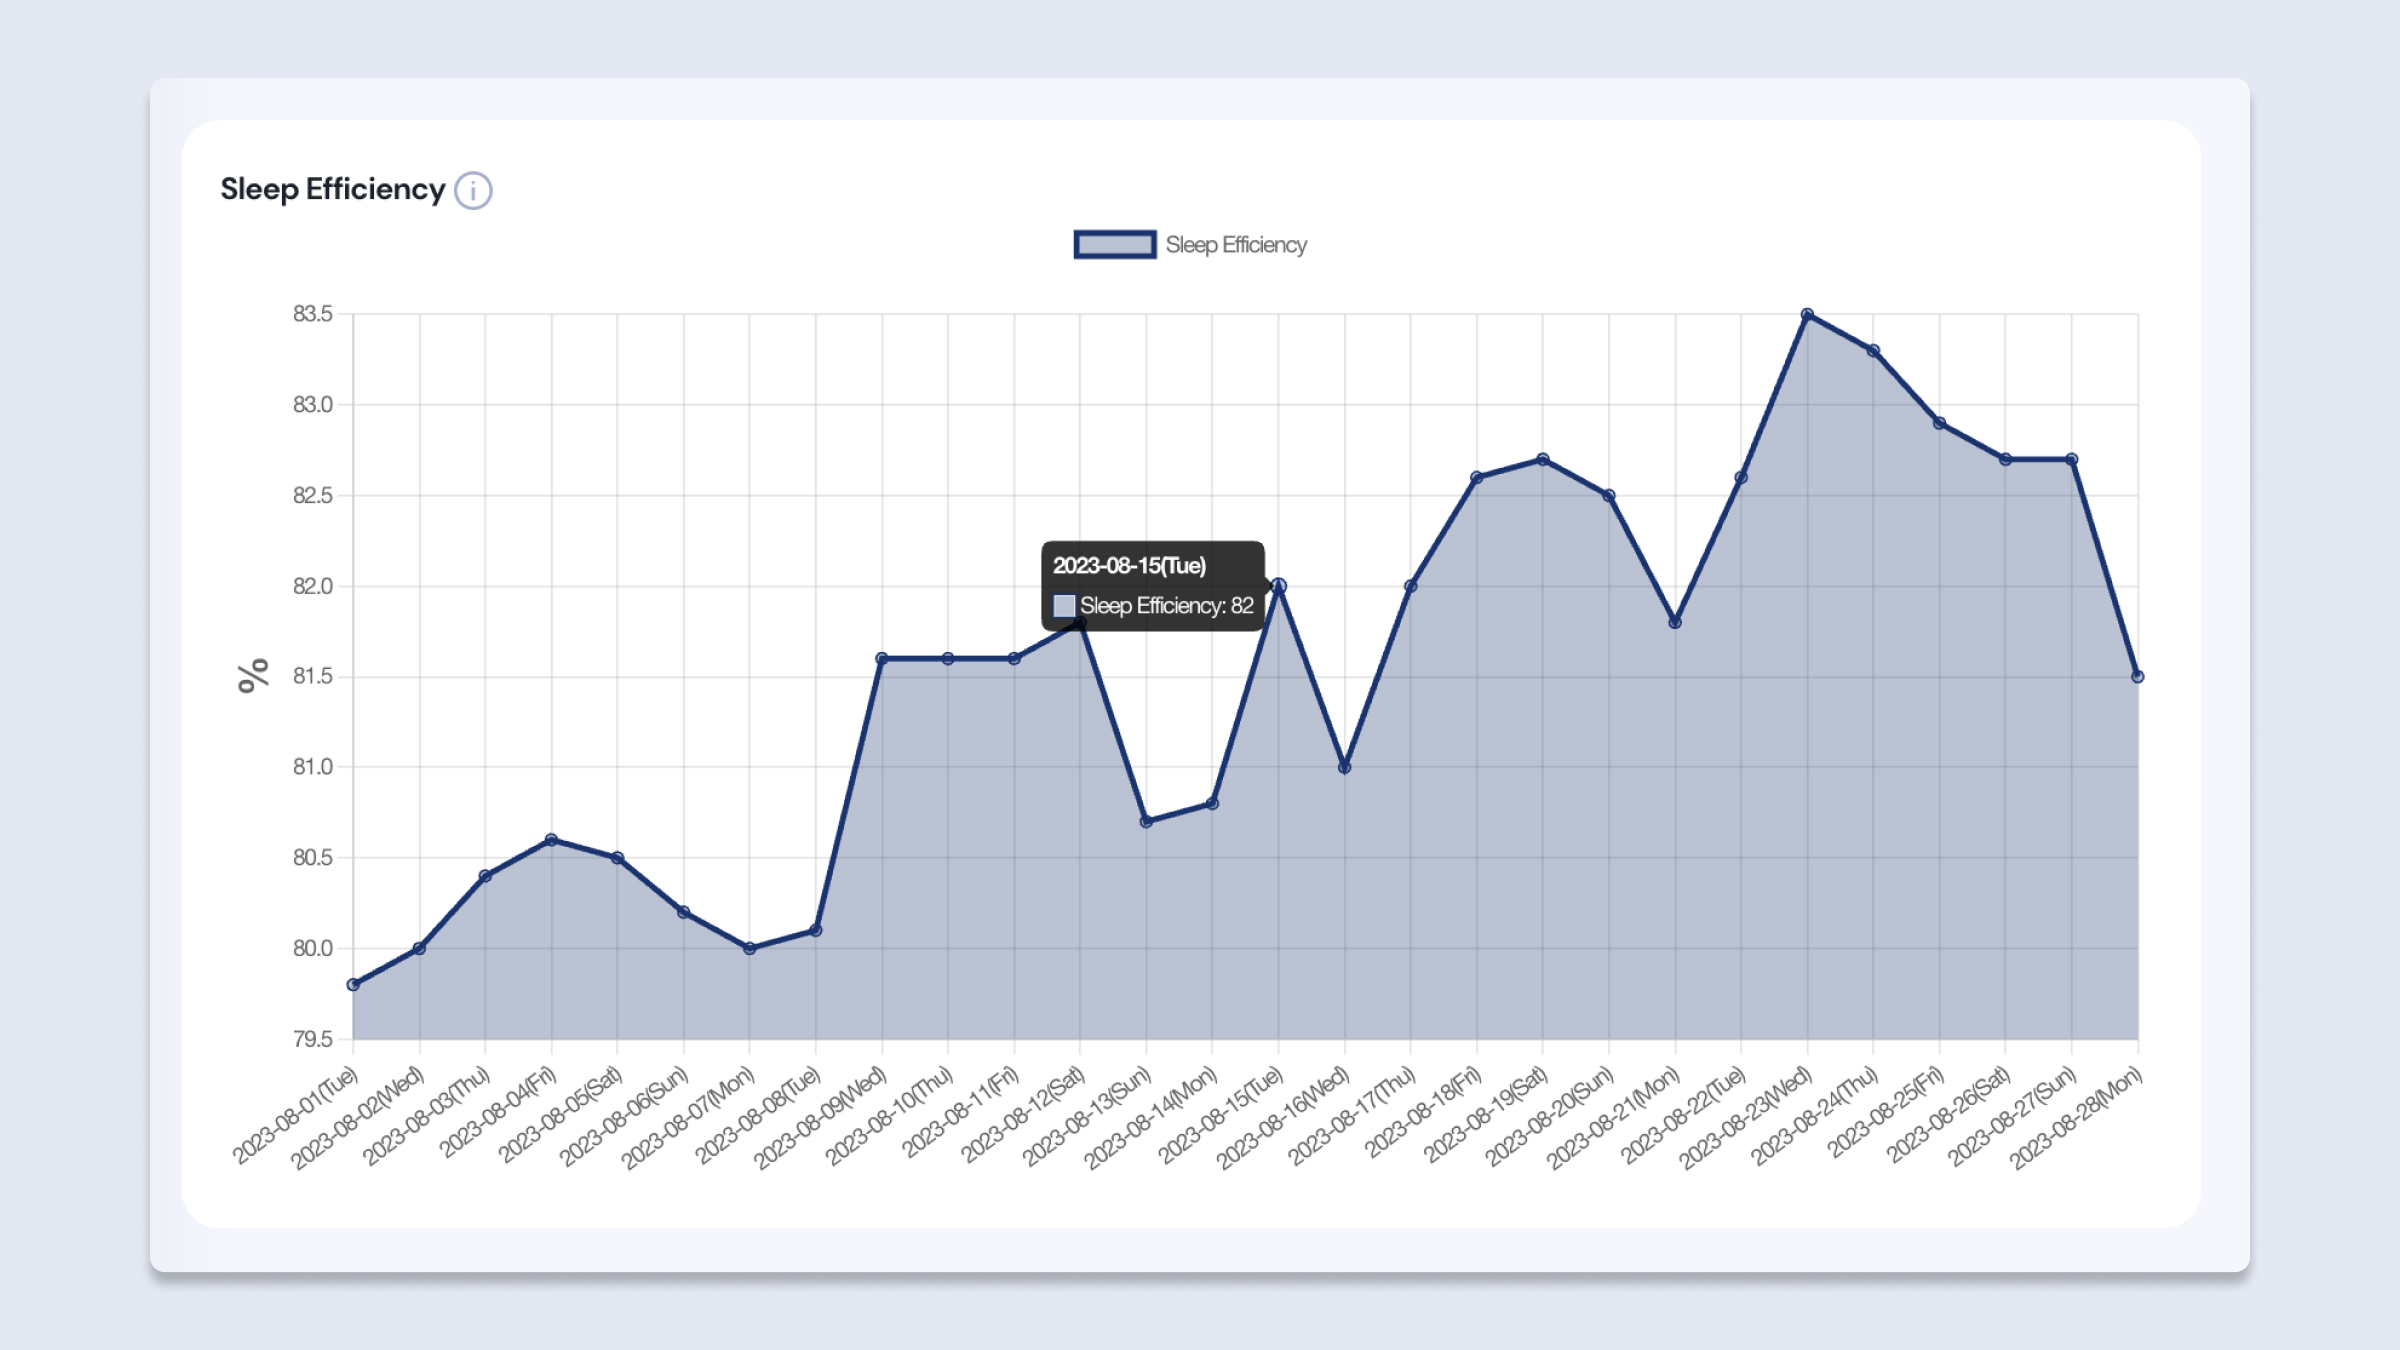
Sleep Reports - Sleep Efficiency
- The Y-axis represents the absolute value, and the X-axis denotes the date.
Sleep Latency
The chart illustrates the trend in the time taken to fall asleep after starting sleep tracking.
- Sleep Latency: Refers to the duration between the start of sleep tracking and the time when one falls asleep.
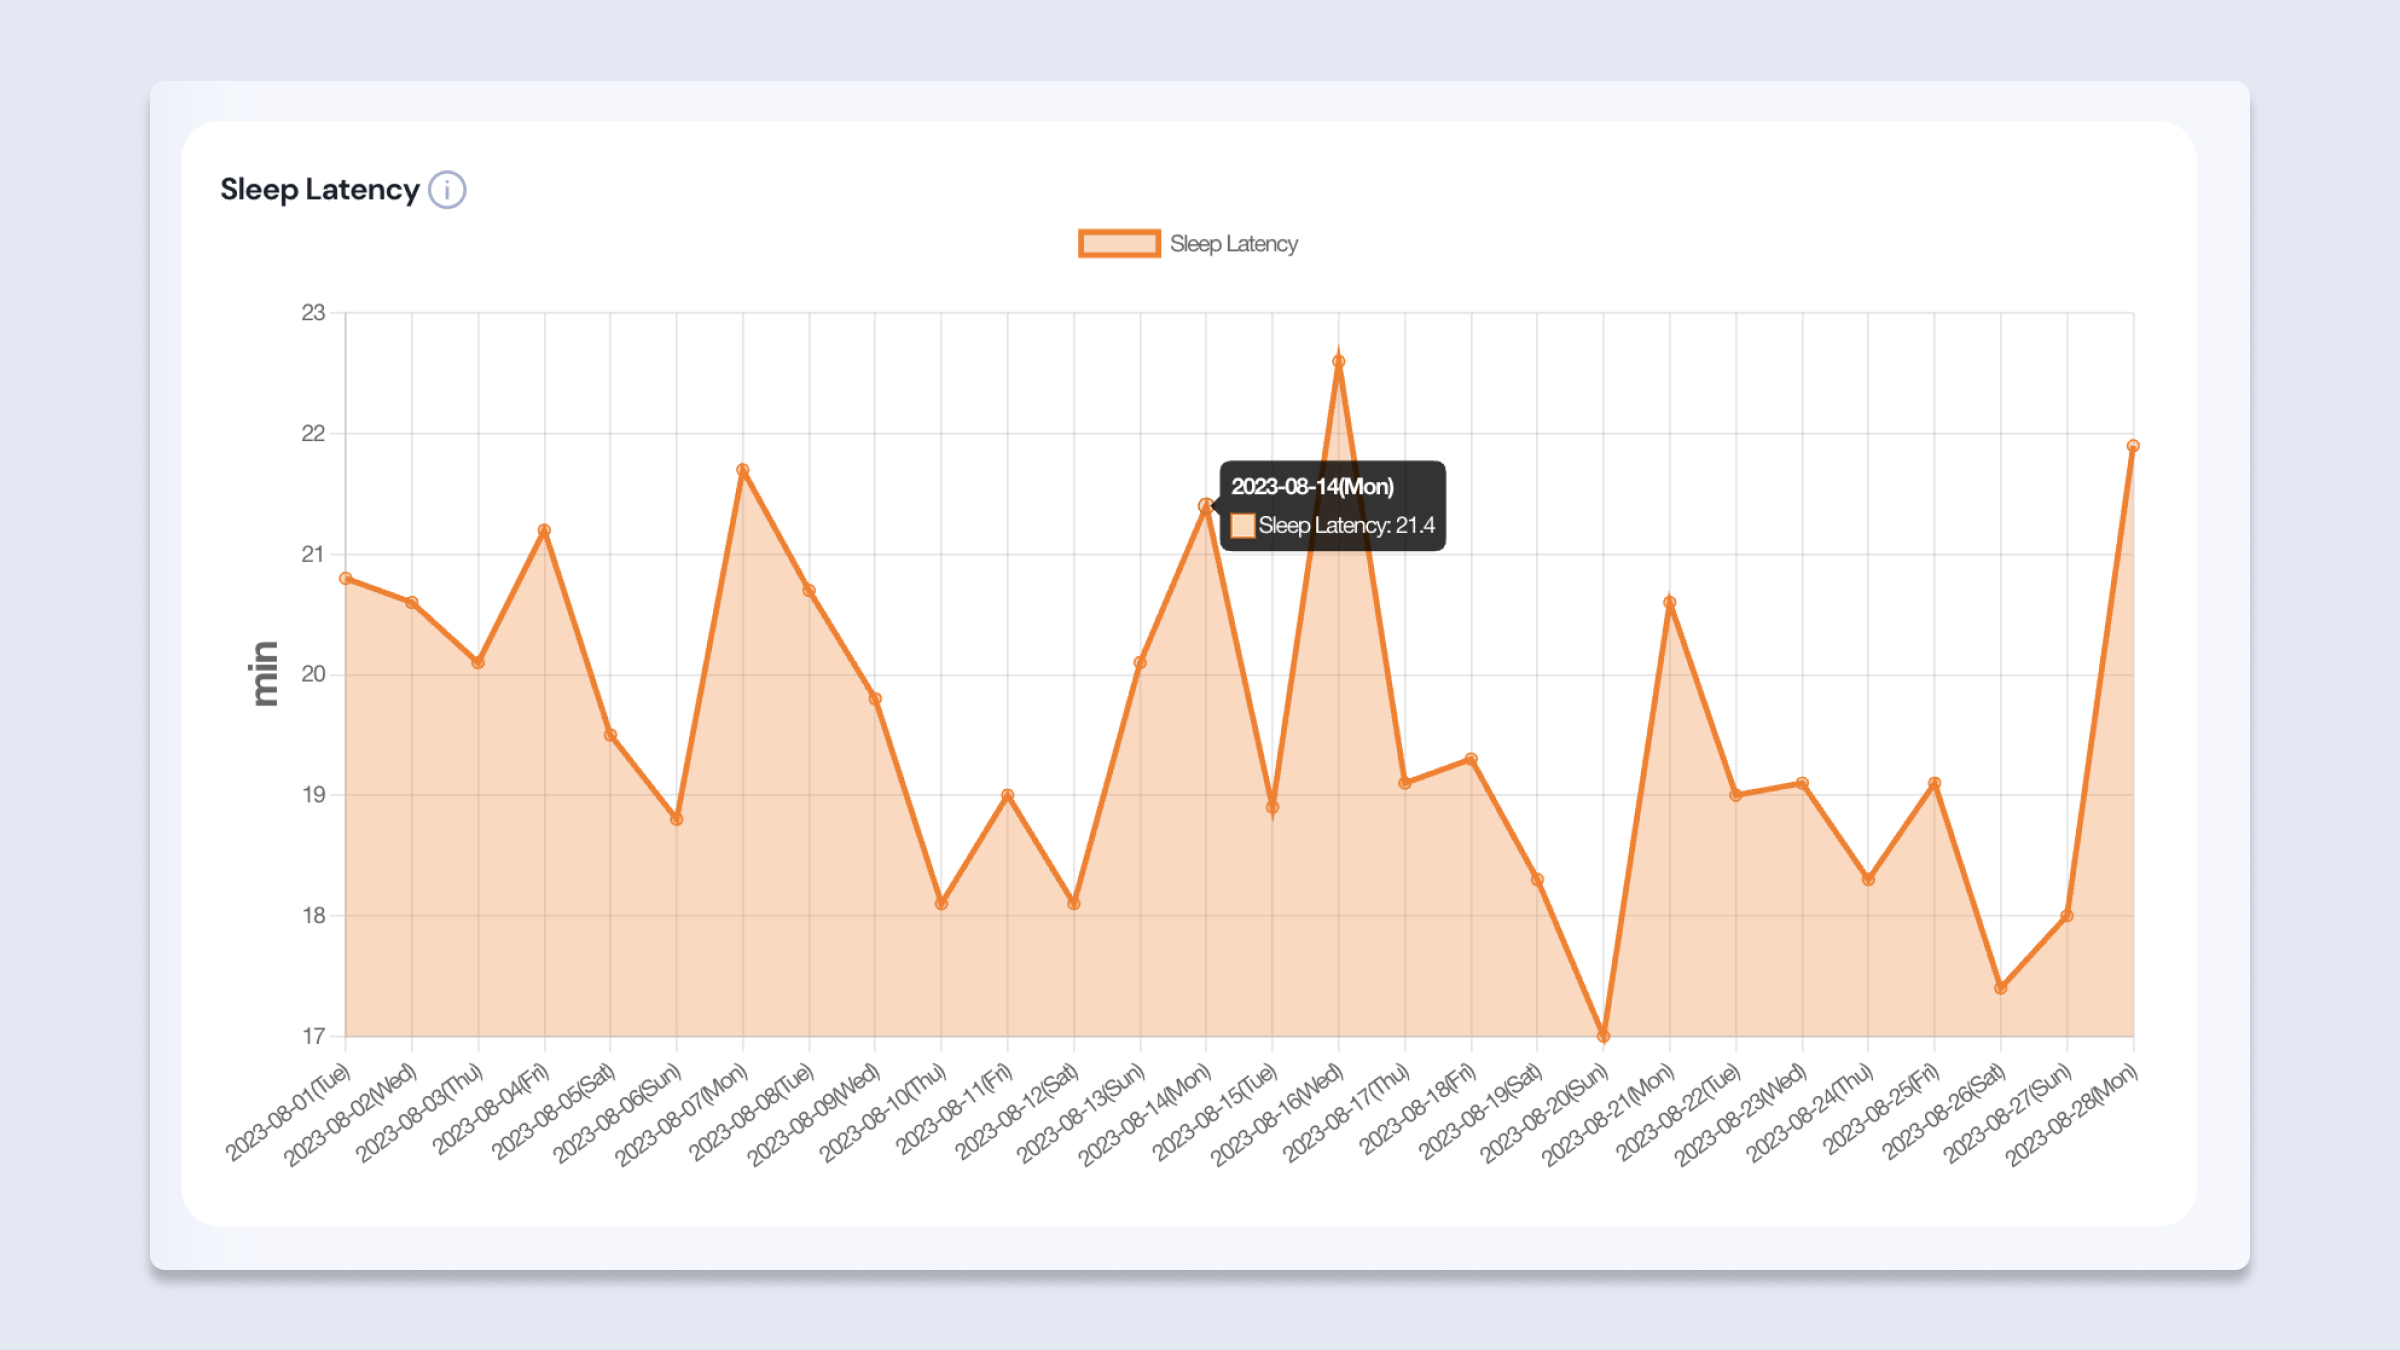
Sleep Reports - Sleep Latency
- The Y-axis represents the absolute value, and the X-axis denotes the date.
Sleep Stage Ratio
The chart depicts the trend in the proportions of 4 sleep stages.
- Wake: Represents the percentage of time one is awake during the sleep tracking period.
- REM: Indicates the percentage of REM sleep during the sleep tracking period.
- Light: Denotes the percentage of light sleep during the sleep tracking period.
- Deep: Refers to the percentage of deep sleep during the sleep tracking period.
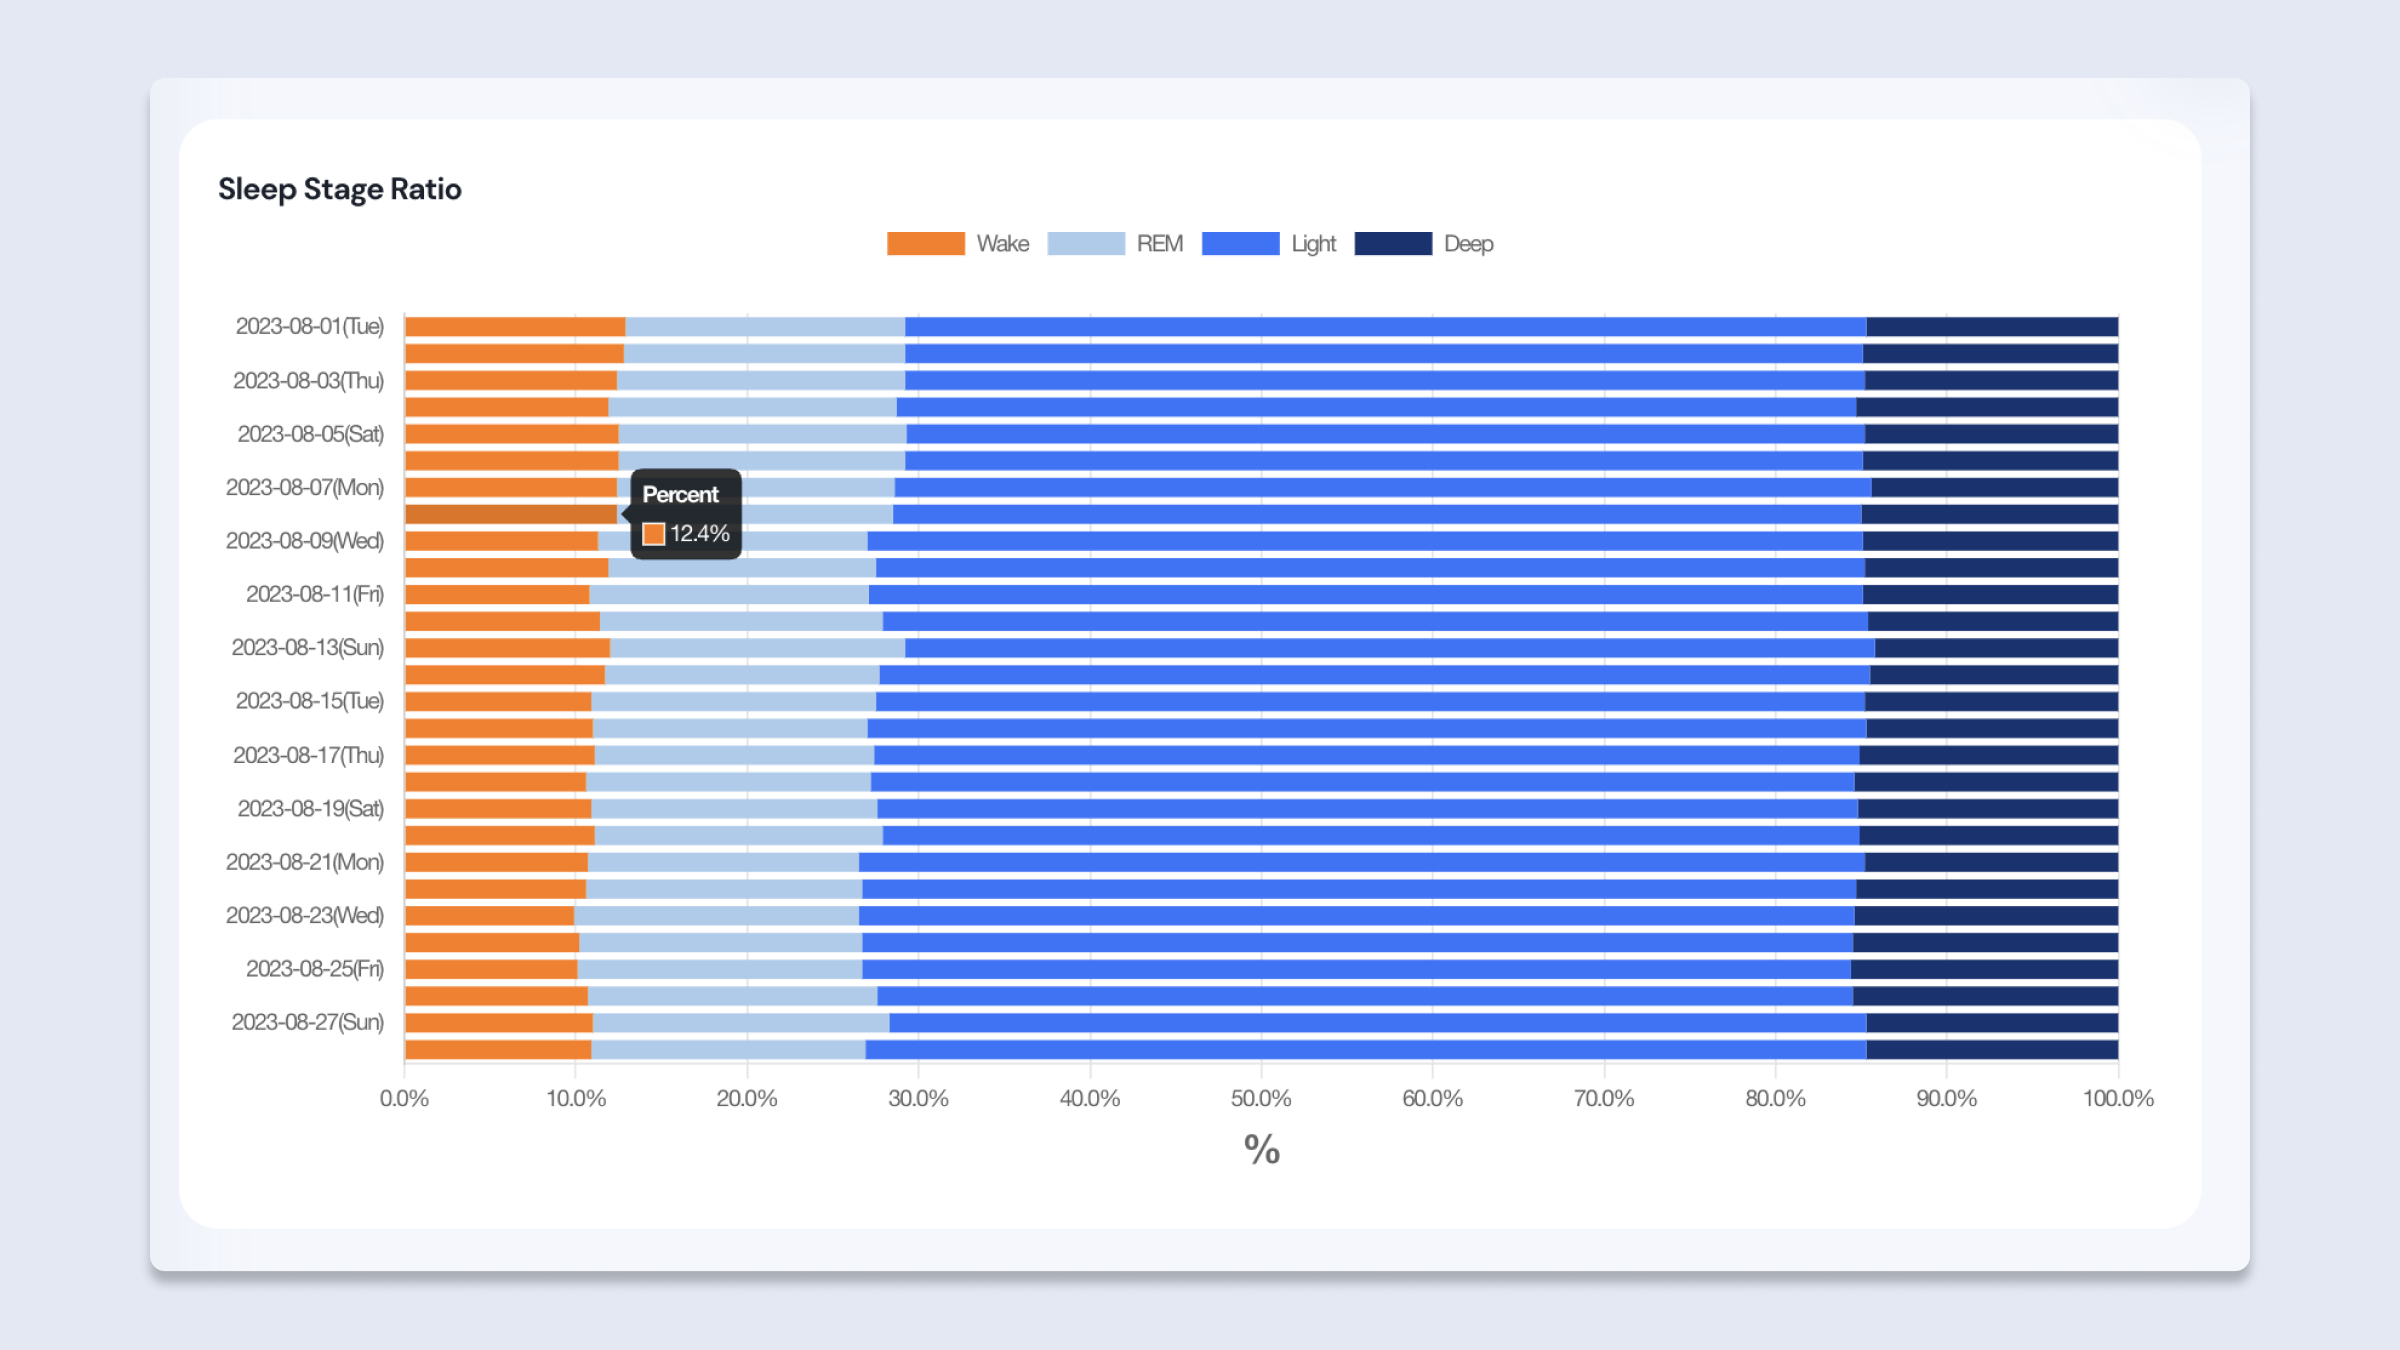
Sleep Reports - Sleep Stage Ratio
- The Y-axis denotes the date, and the X-axis represents the percentage.
Updated about 1 year ago