
Home
Home Tab
Introduction
In the Home tab, you can check account details, plan information, and API usage-related data.
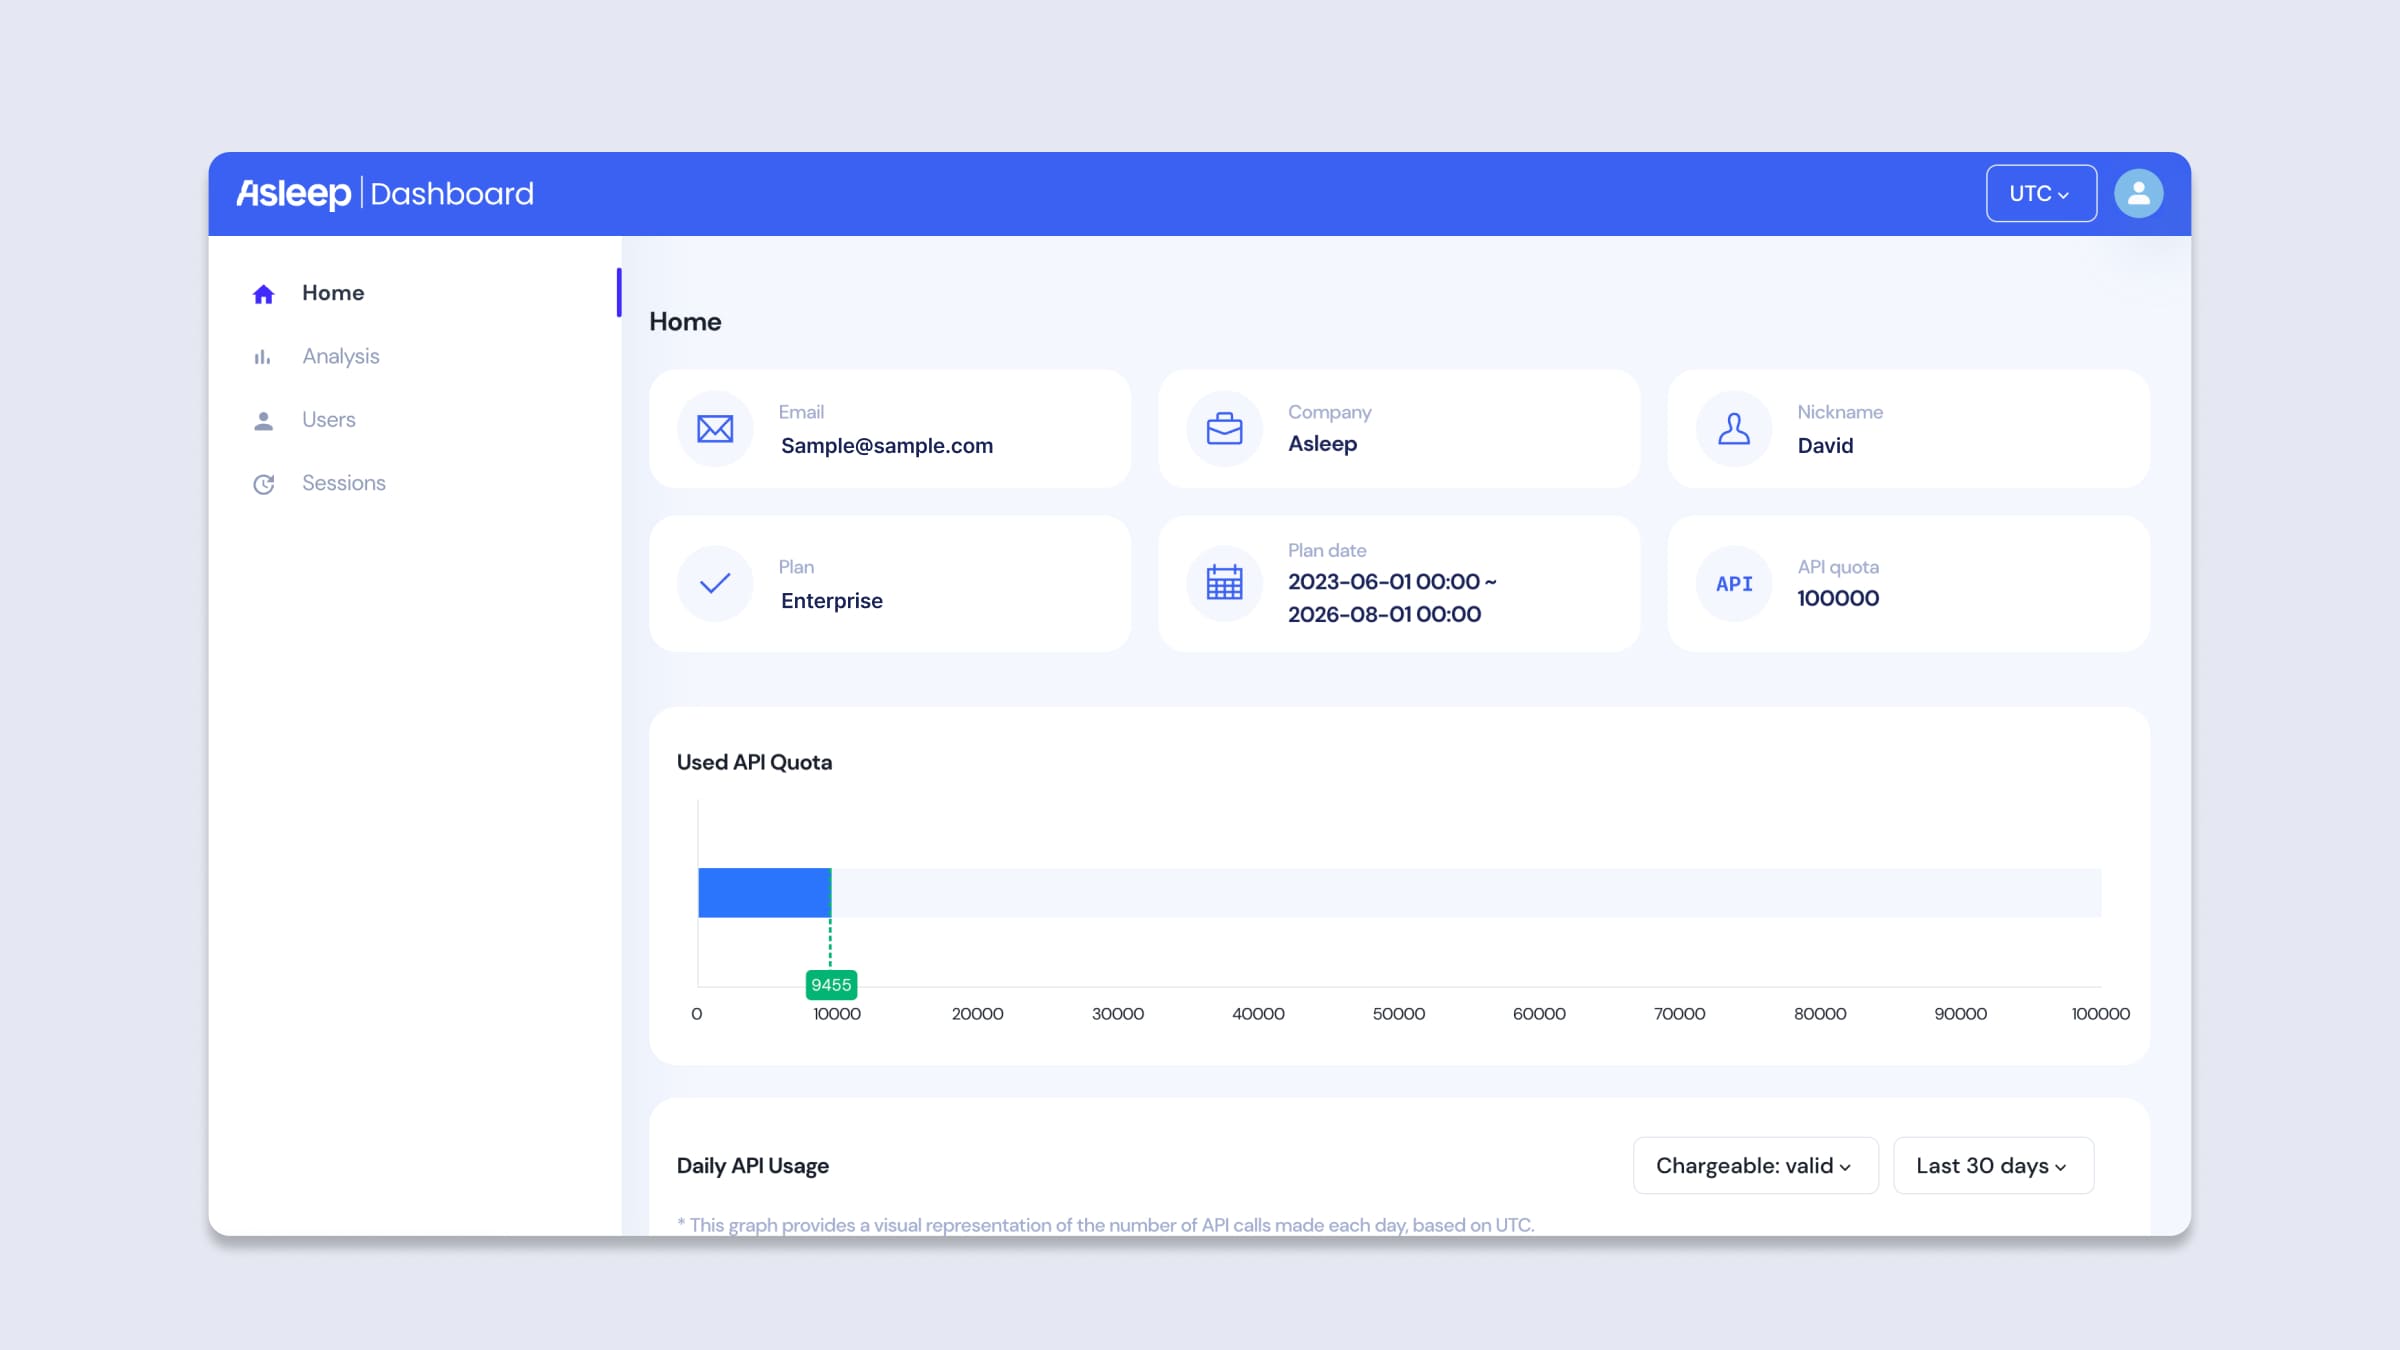
Dashboard Home
Account/Plan Information
Account
- Email: This serves as your account ID and the email address where you receive communications. This ID cannot be altered.
- Company: Represents the company name. This can be modified in the settings.
- Nickname: Refers to the name or nickname of the account manager or user. This can be changed in the settings.
Account Information
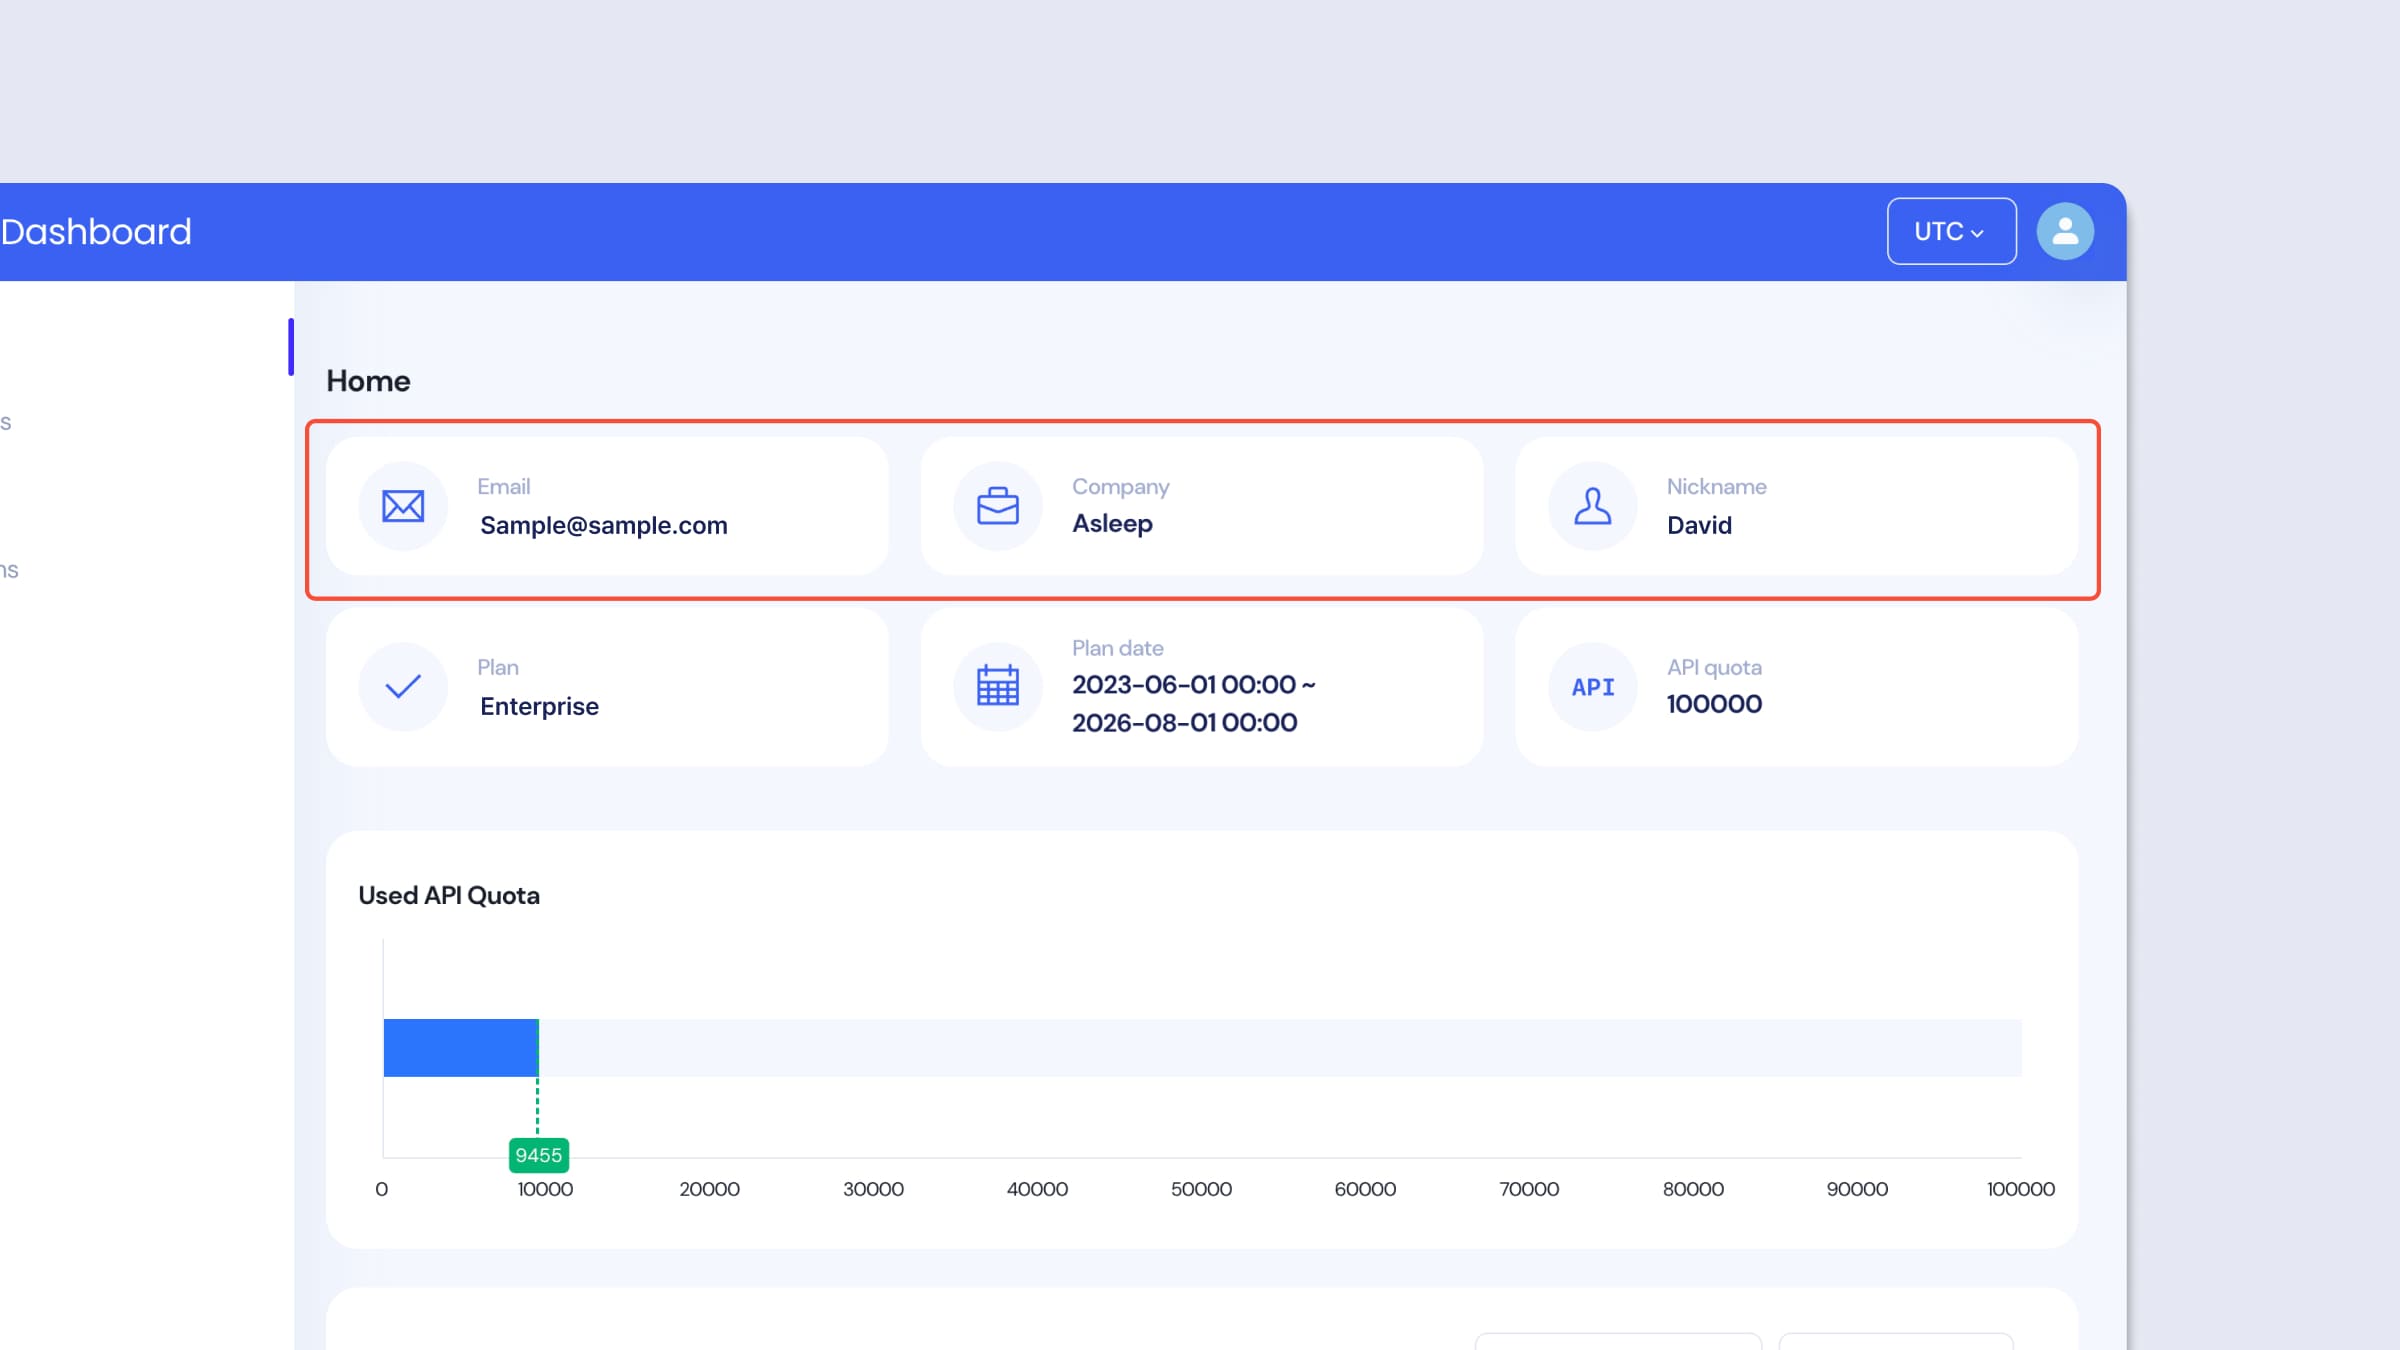
Plan
- Plan: Displays the current plan in use. It is divided into [Trial Plan] and [Enterprise Plan].
- Plan Date: Shows the duration of the current plan in use. Once this duration expires, usage of the Asleep API will be halted.
- API Quota: Indicates the number of API calls contracted. If you exceed this number, the use of the Asleep API will be stopped. API usage is reported regularly via email, and if there's a risk of exceeding the quota, you will be notified by email.
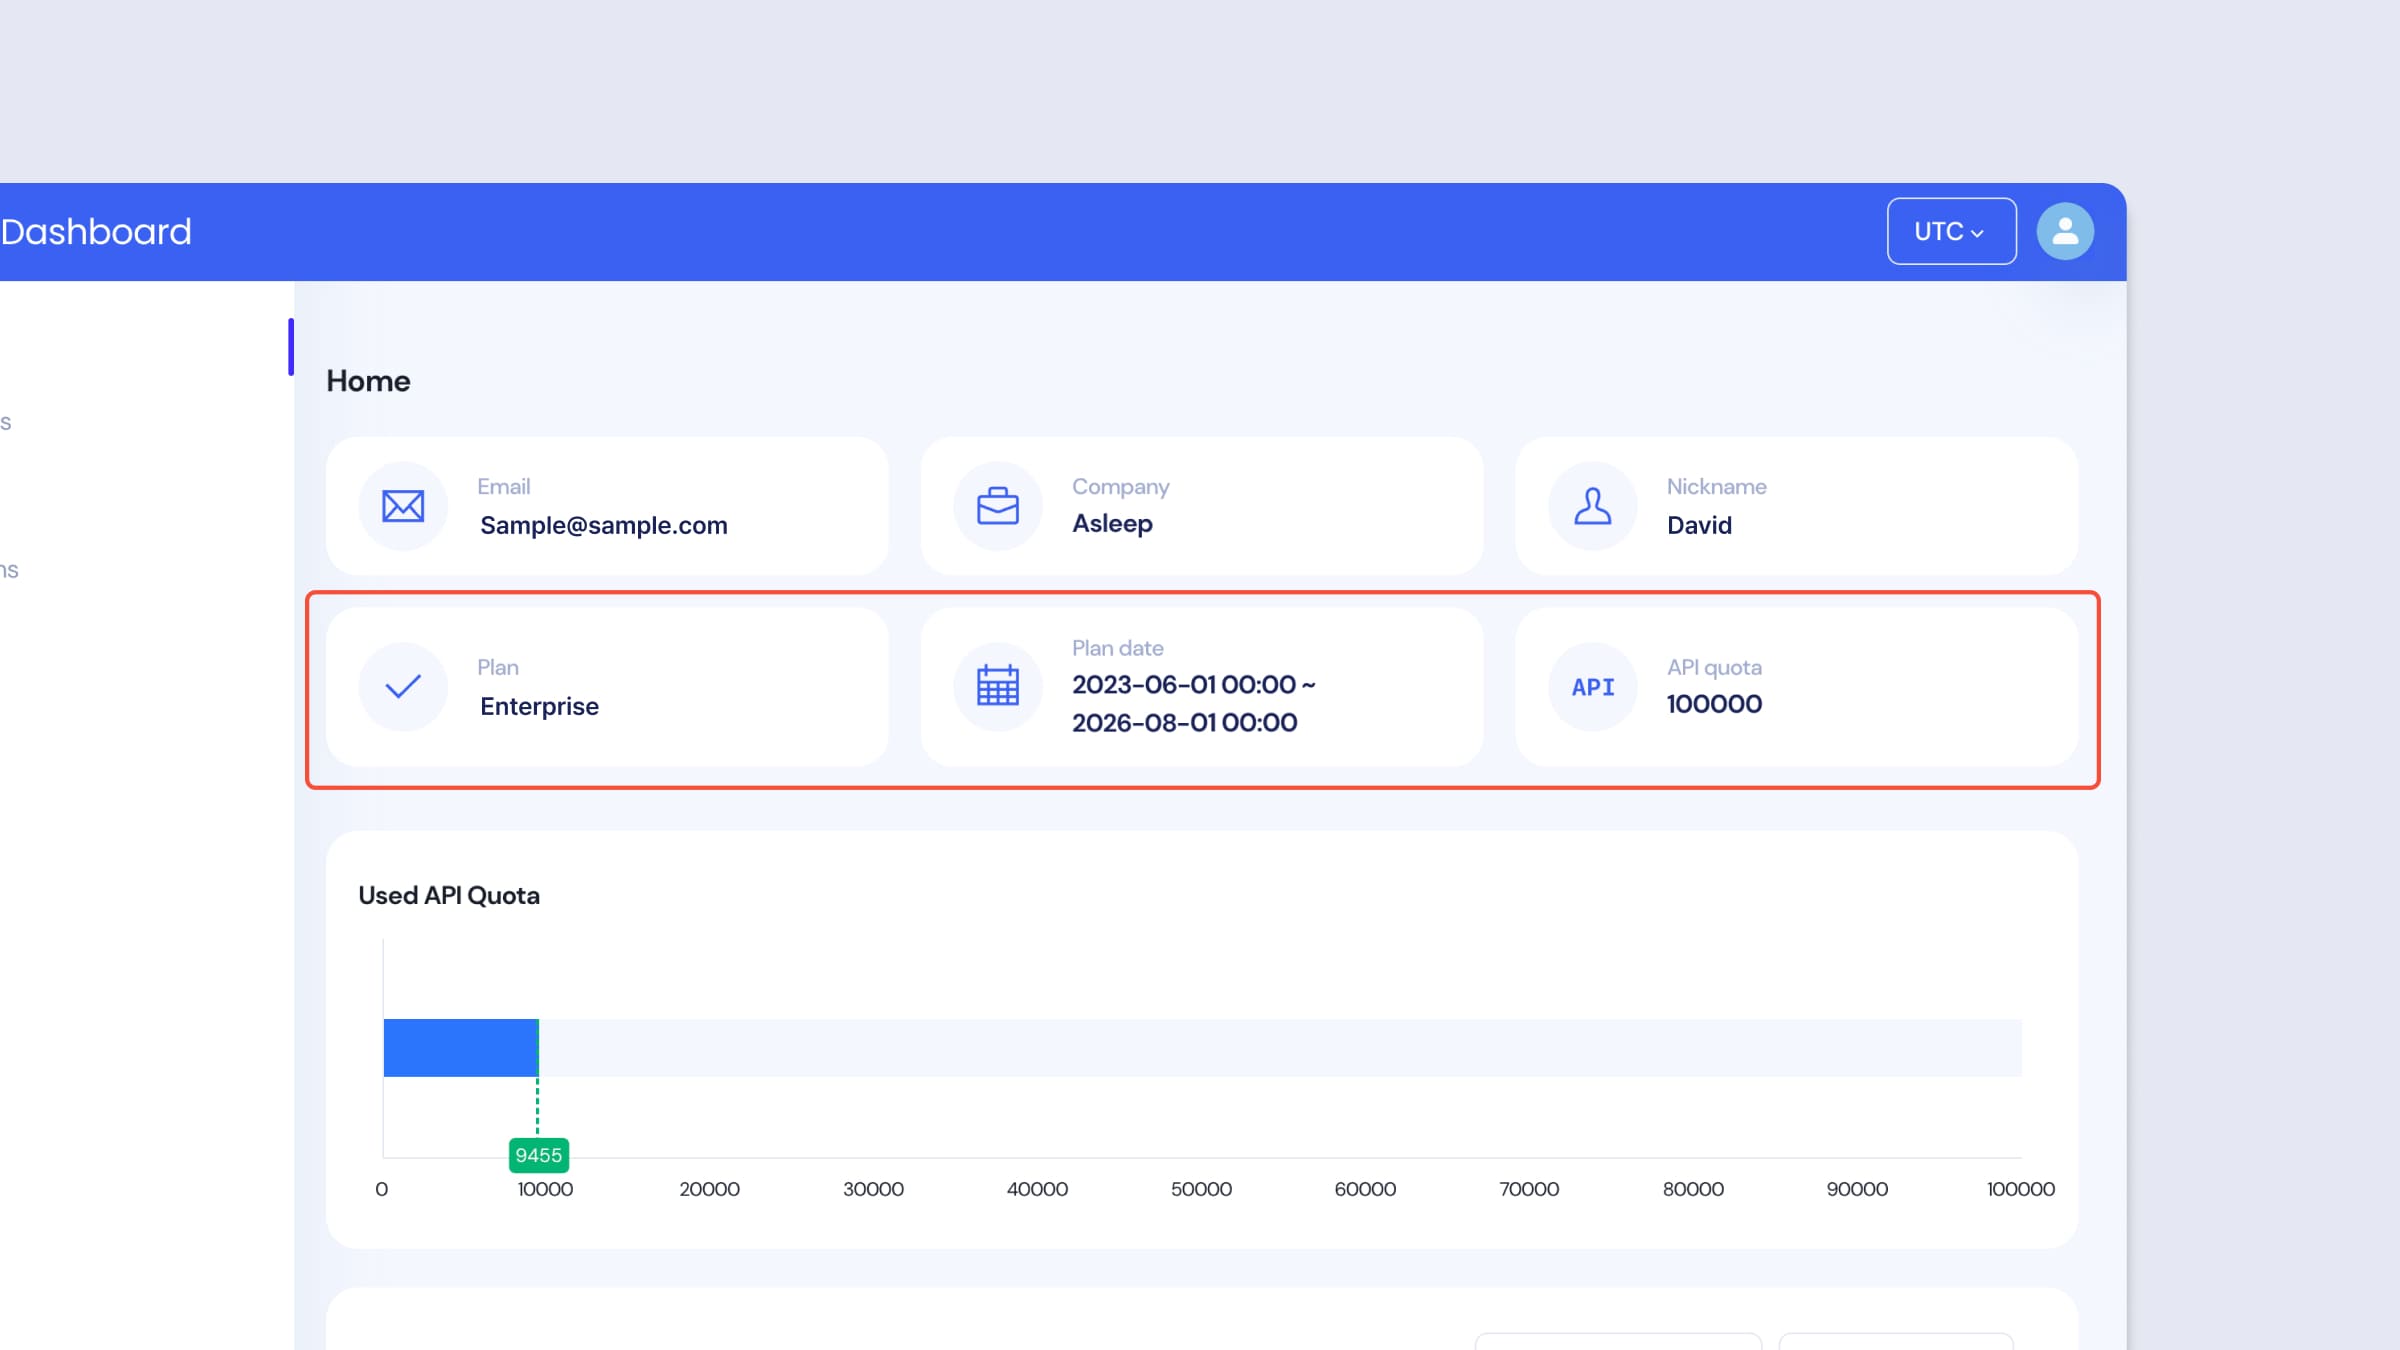
Plan Information
API Usage Chart
Used API Quota
- Displays the API usage from the start date of the plan to the present.
- You can hover over the bar graph to see the exact figures.
- Only valid API usage is counted.
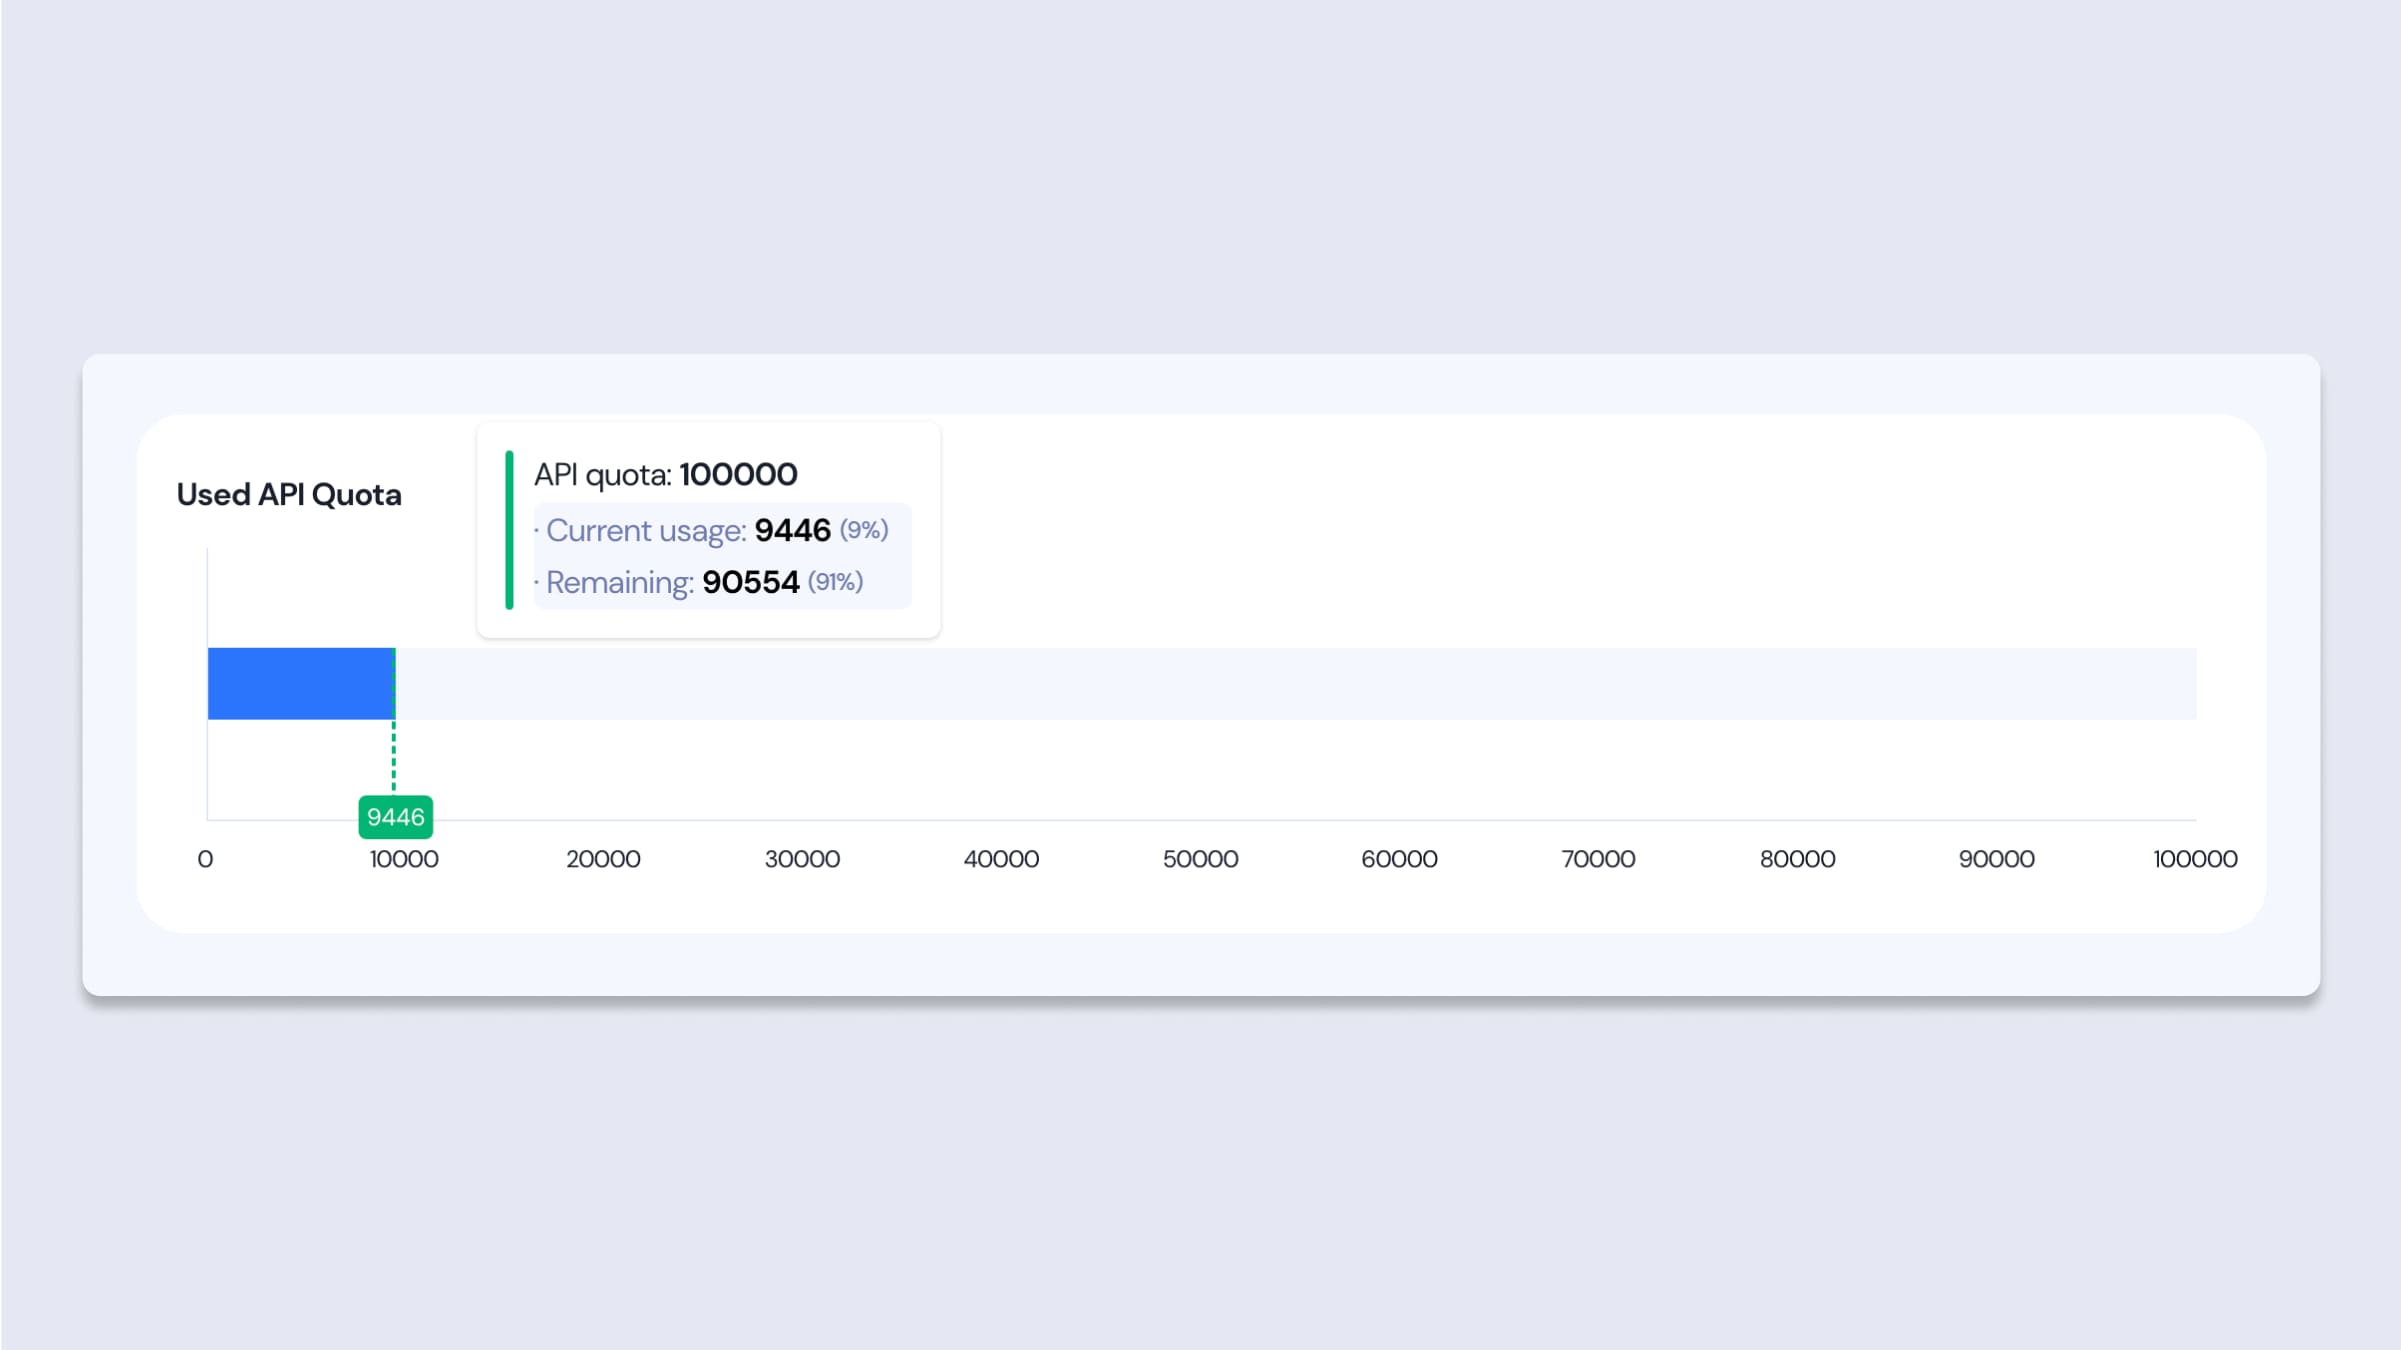
Used API Quota Chart
Daily API Usage
Description
- The Daily API Usage graph represents the number of API uses in a day. Through this graph, you can easily understand the daily API call patterns and counts.
- Insights such as peak usage days, weekdays, or discovering unexpected API call patterns can be obtained.
- Data is aggregated based on UTC time (KST-9). You can verify the precise API usage for the previous day based on UTC the following day.
- By hovering over each daily point, you can determine the exact figures.
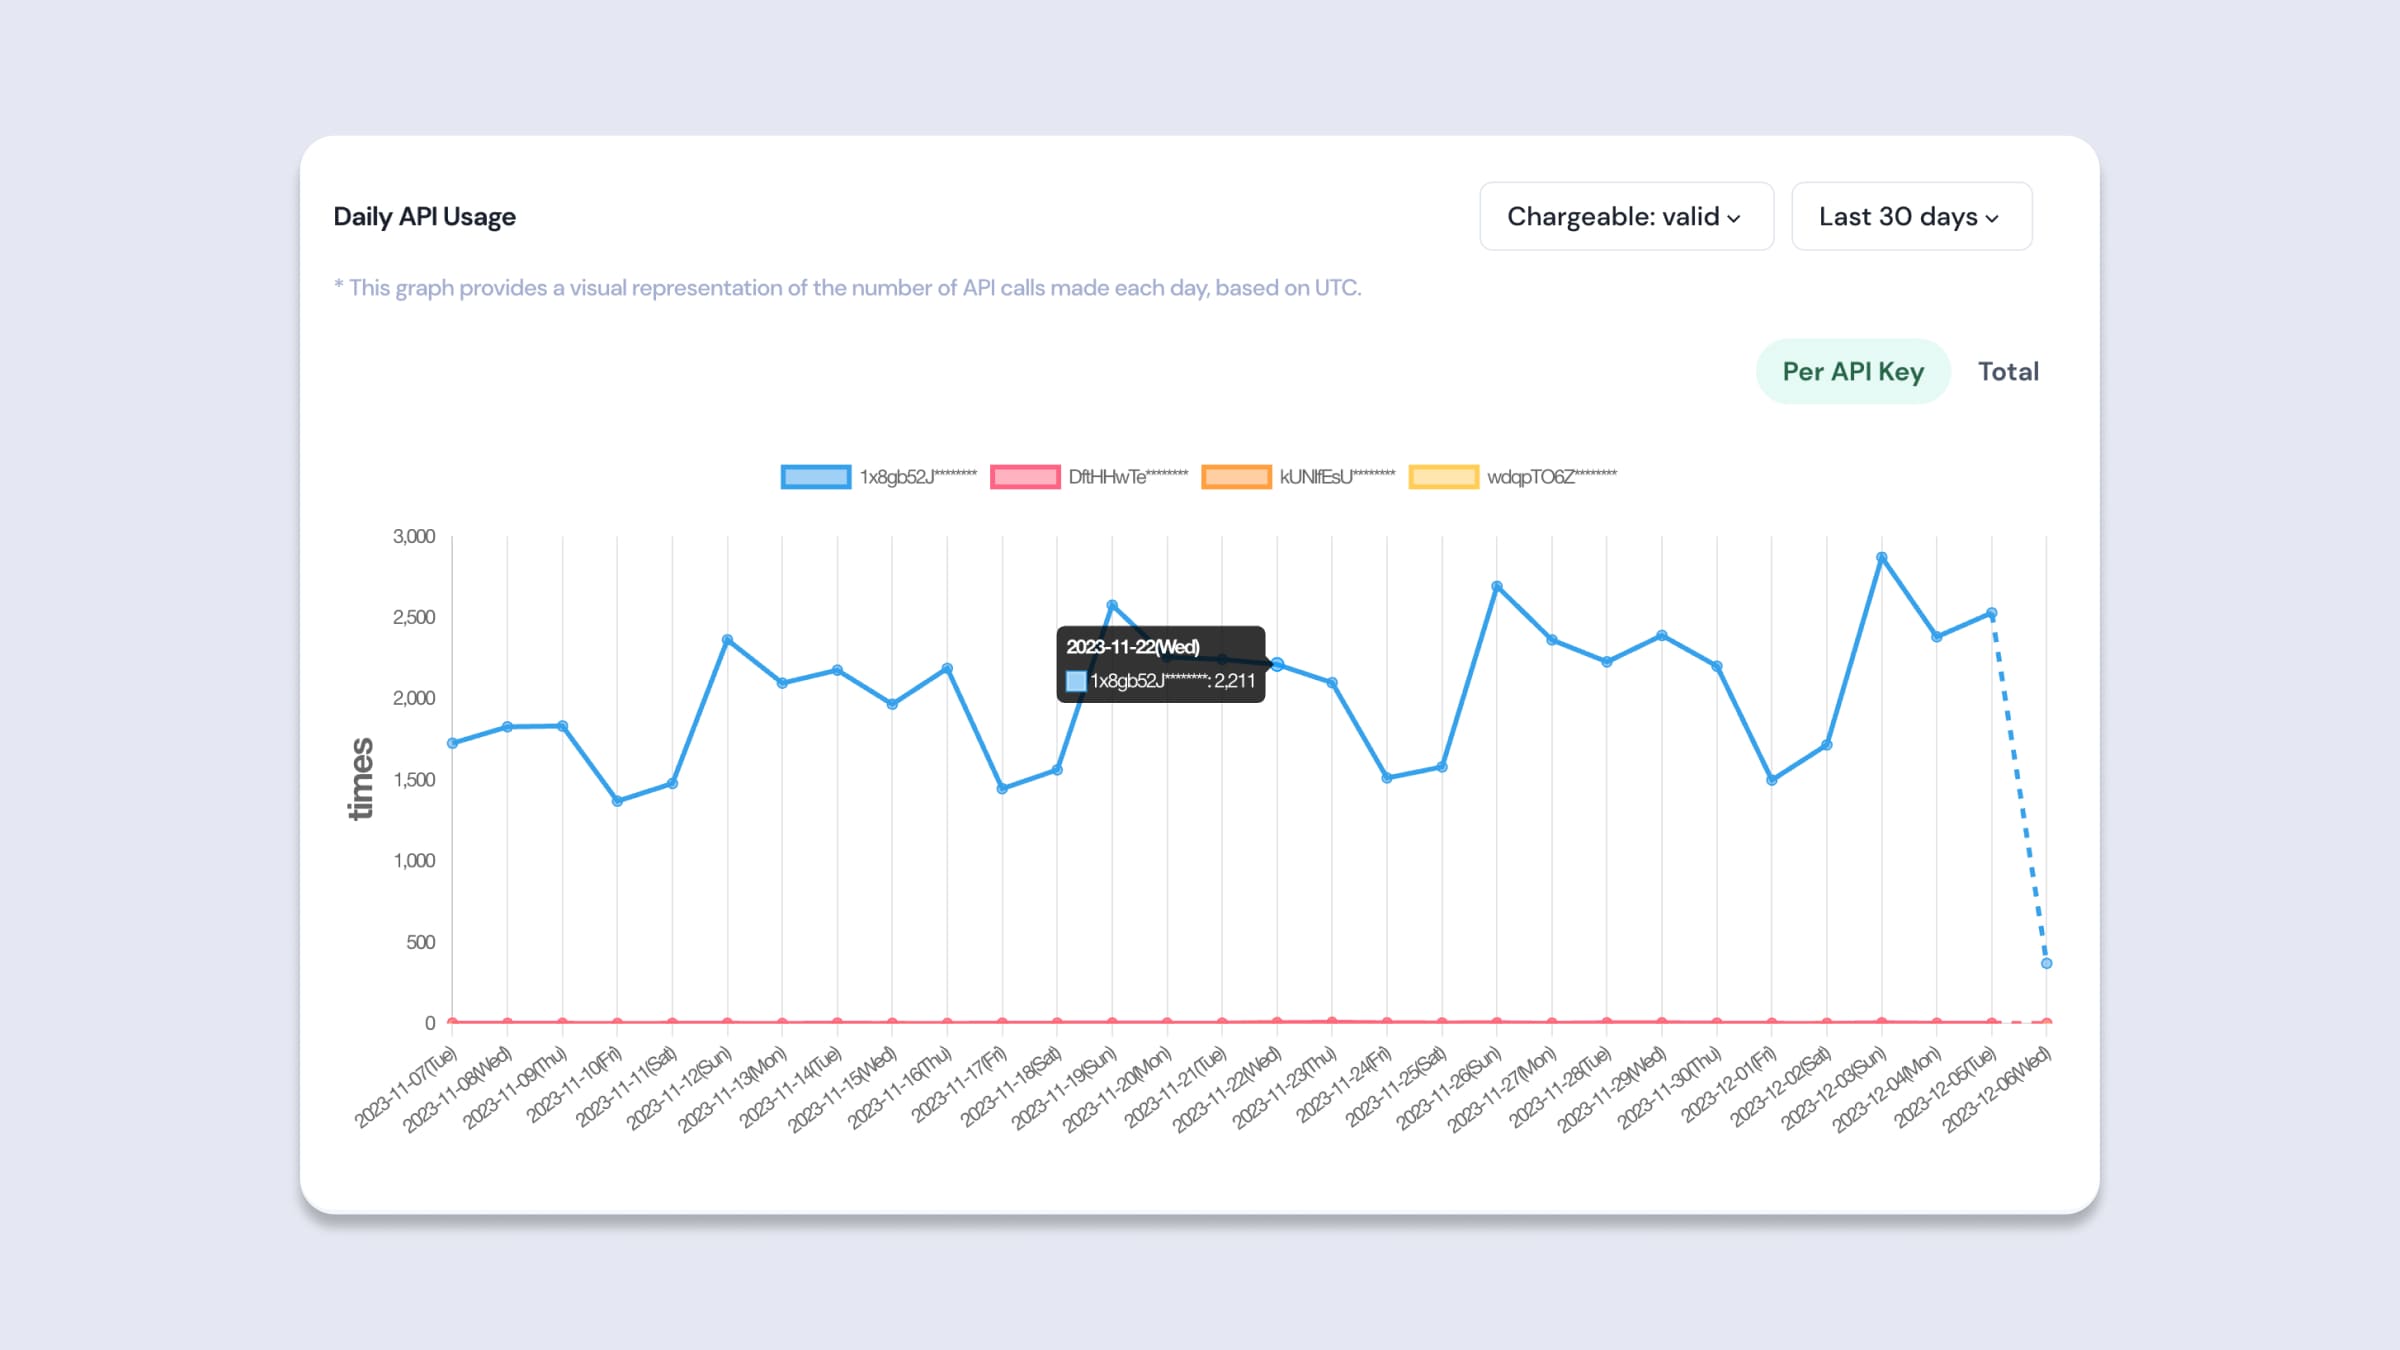
Daily API Usage Chart
Filters
- Chargeable
You can view either the valid or invalid API calls separately, or view the sum of valid + invalid API calls together.- Chargeable: valid
Represents valid API calls, and only shows API calls that created a session after sleep tracking and the analysis was completed. You're charged only for these API calls, and they are deducted from the contracted API call count. - Chargeable: invalid
Represents invalid API calls and only reflects API calls that generated a session after sleep tracking, regardless of whether the analysis was completed or not. These API calls are not charged, and are not deducted from the API call count. - Chargeable: total
Represents all API calls.
- Chargeable: valid
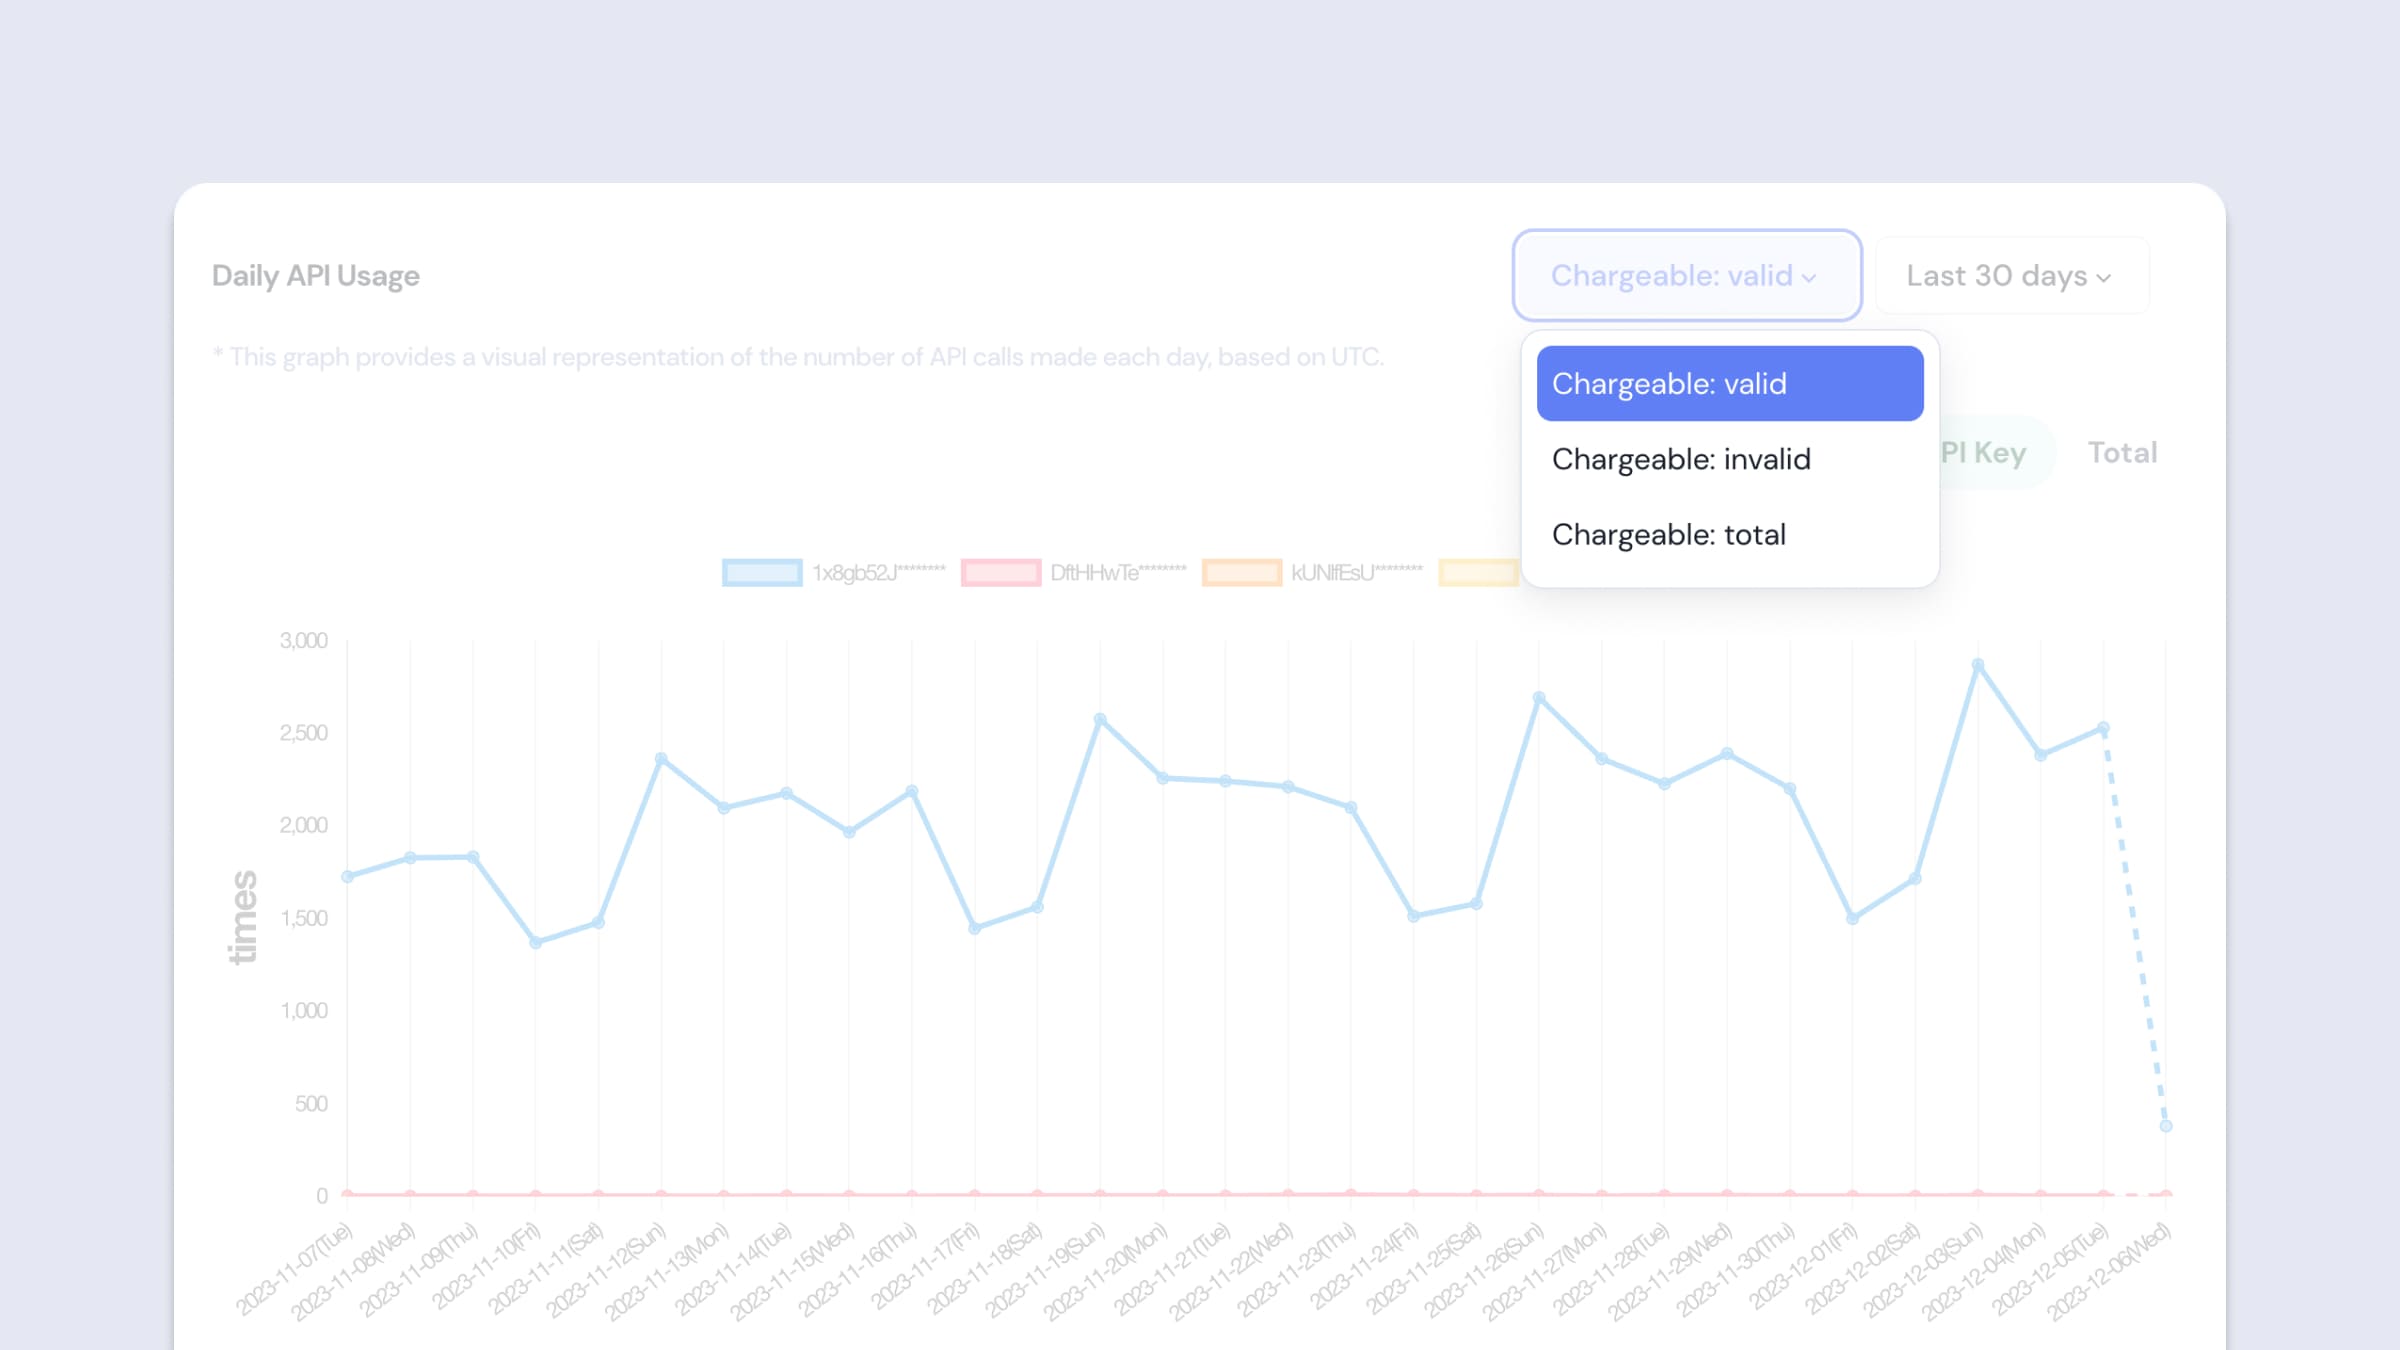
Daily API Usage Filter - Chargeable
- Date
You can choose the period you want to view. If there's no adjustment, the most recent month from the current date will be displayed.- Last 7 days: You can view the API usage data for the most recent 7 days from the current date.
- Last 15 days: You can view the API usage data for the most recent 15 days from the current date.
- Last 30 days: You can view the API usage data for the most recent 30 days from the current date.
- Last 3 months: You can view the API usage data for the most recent 3 months from the current date.
- Custom: You can directly select the period of API usage data you want to view from the calendar. The date selection is available up to a maximum of one month.
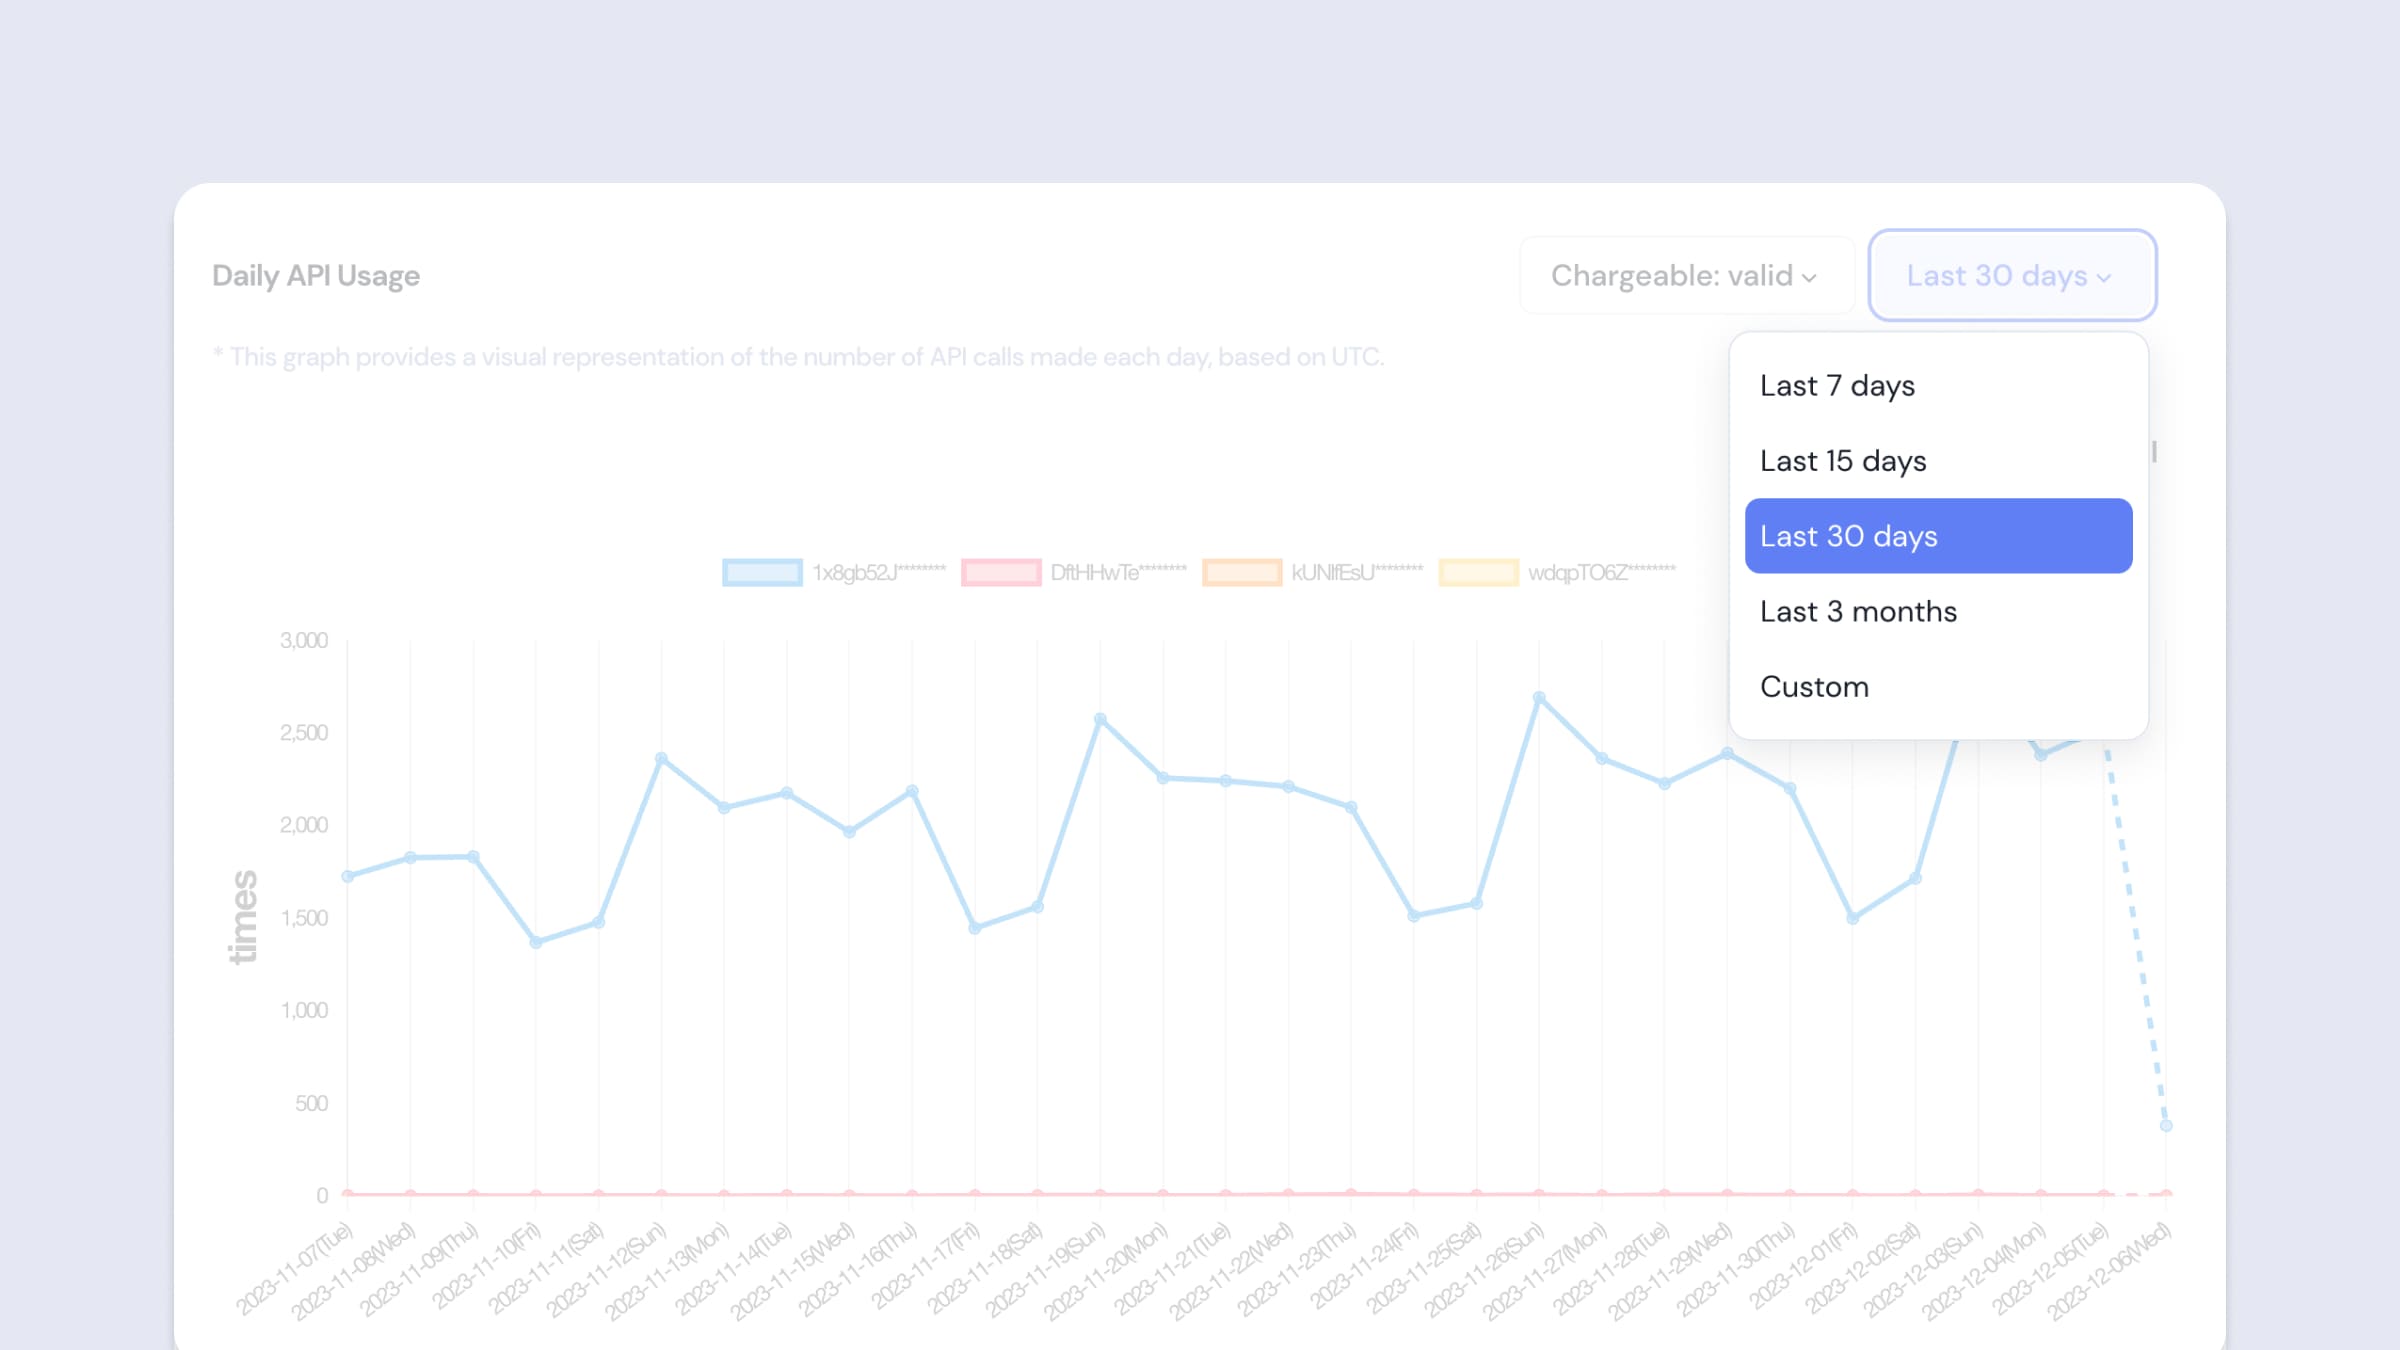
Daily API Usage Filter - Date
- Per API Key / Total
If you have more than one API Key, you can view the data separated by each API Key or view the combined data of all. If you only have one API Key, you will see the same data.- Per API Key: You can view the API usage data separated by each API Key. By clicking on the graph legend, you can also select and view data for the desired API Key only.
- Total: Displays the combined data of all API Keys.
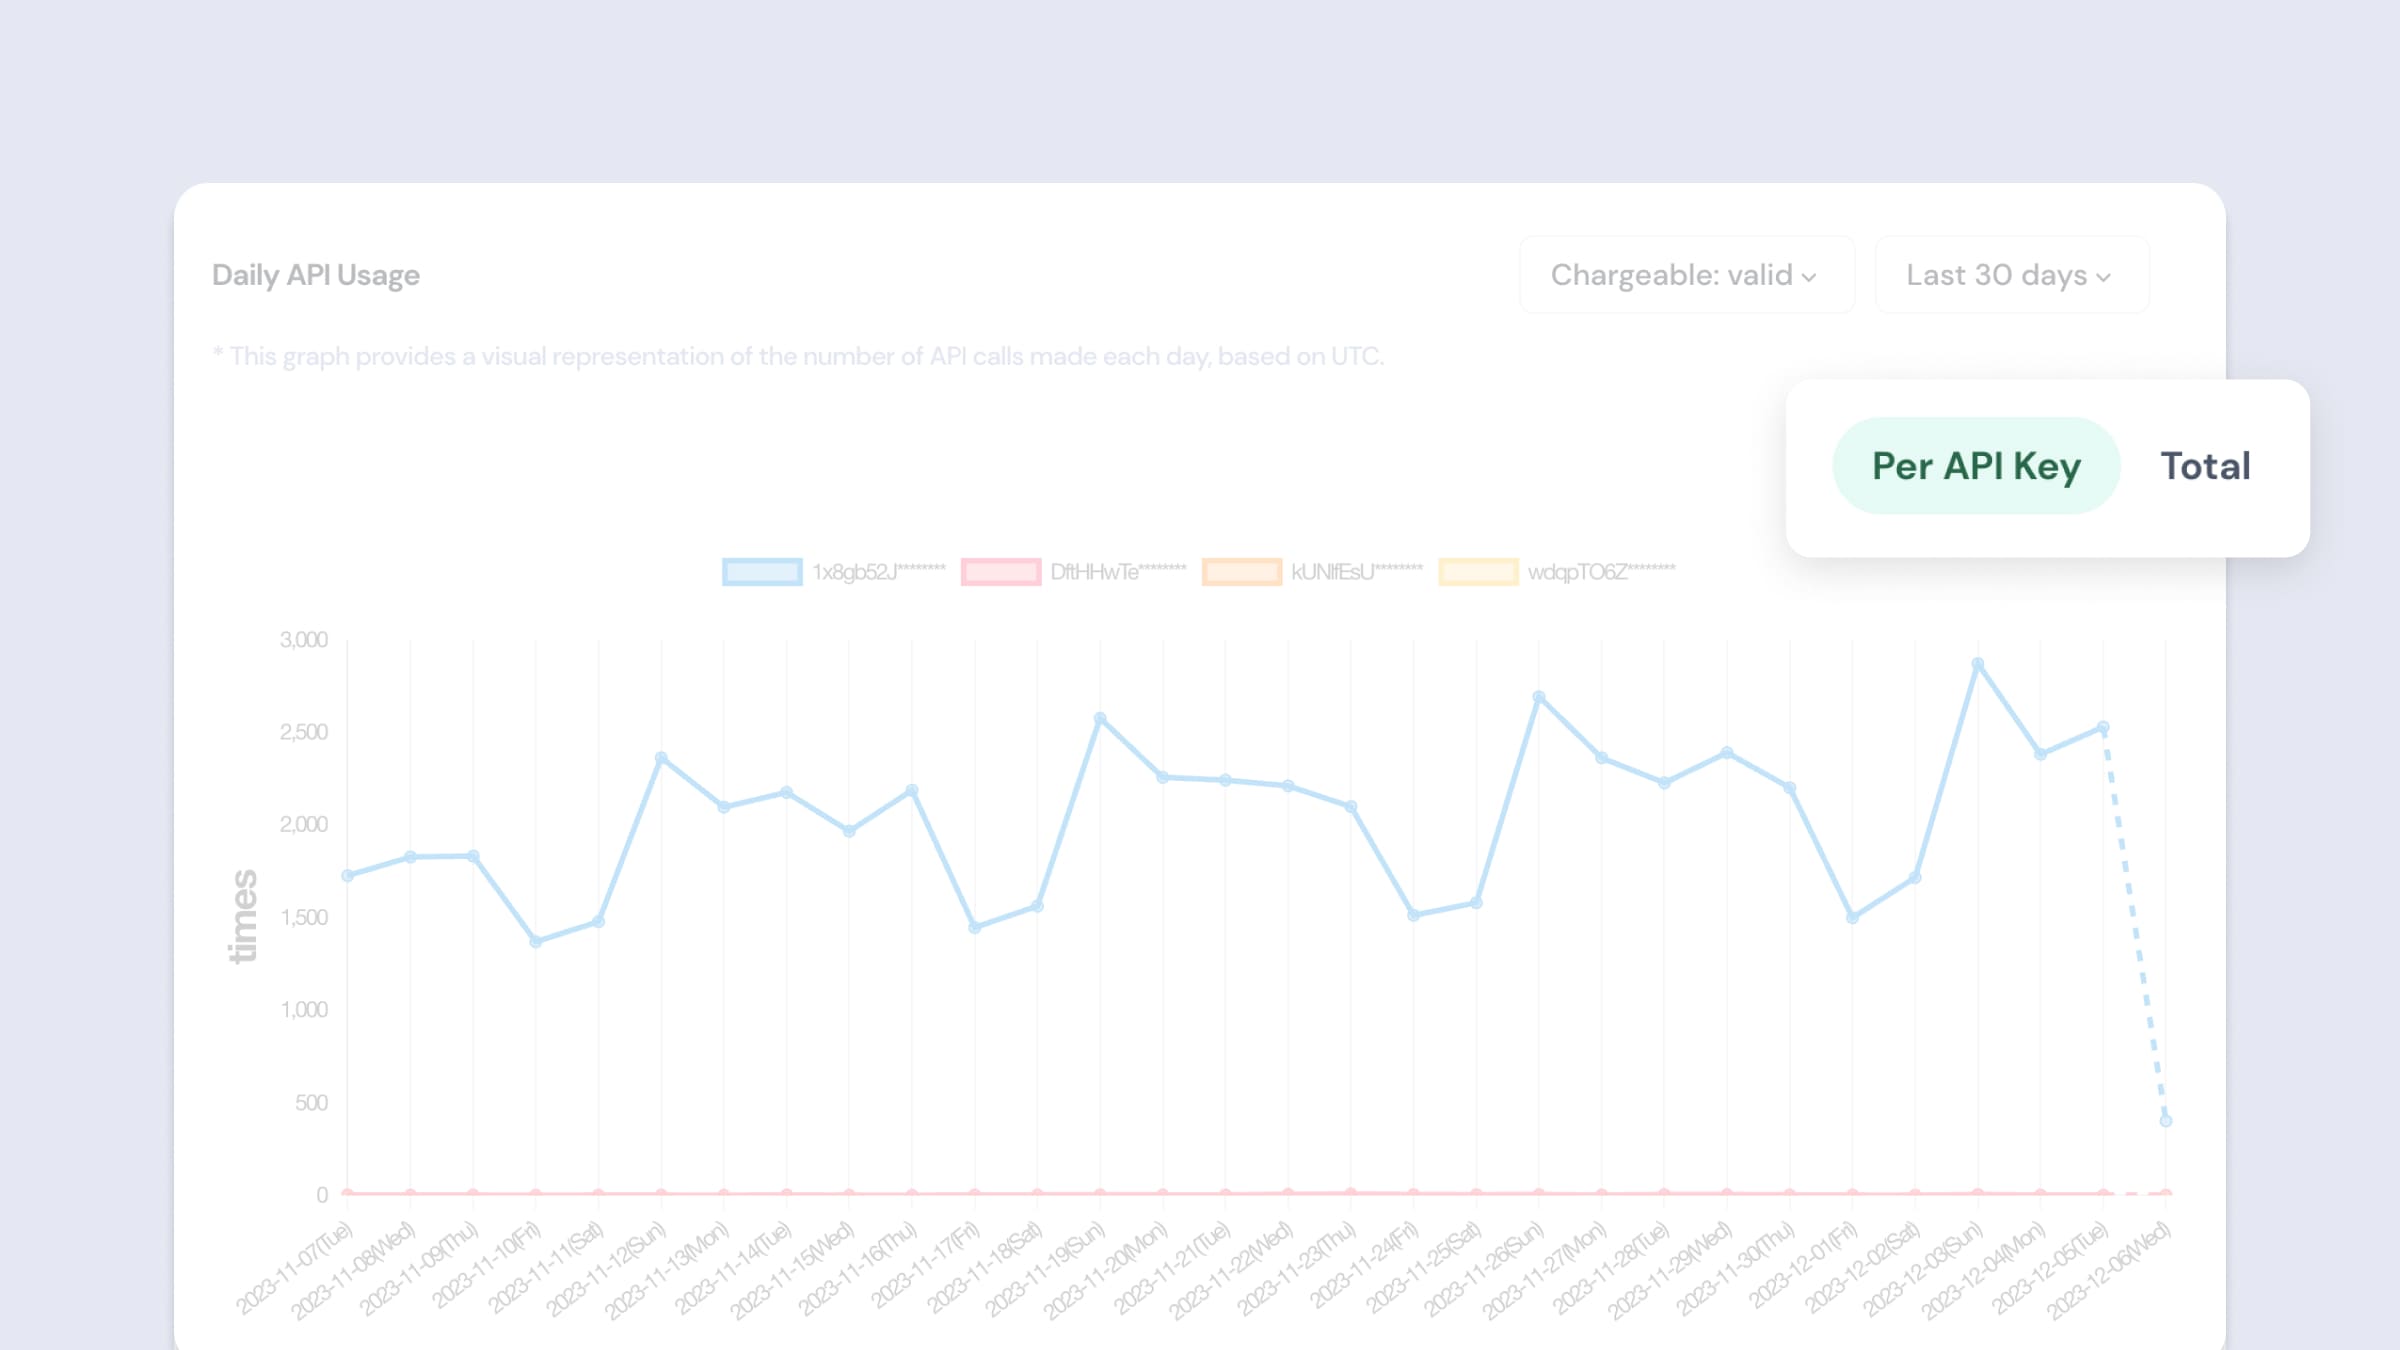
Daily API Usage Filter - API Key
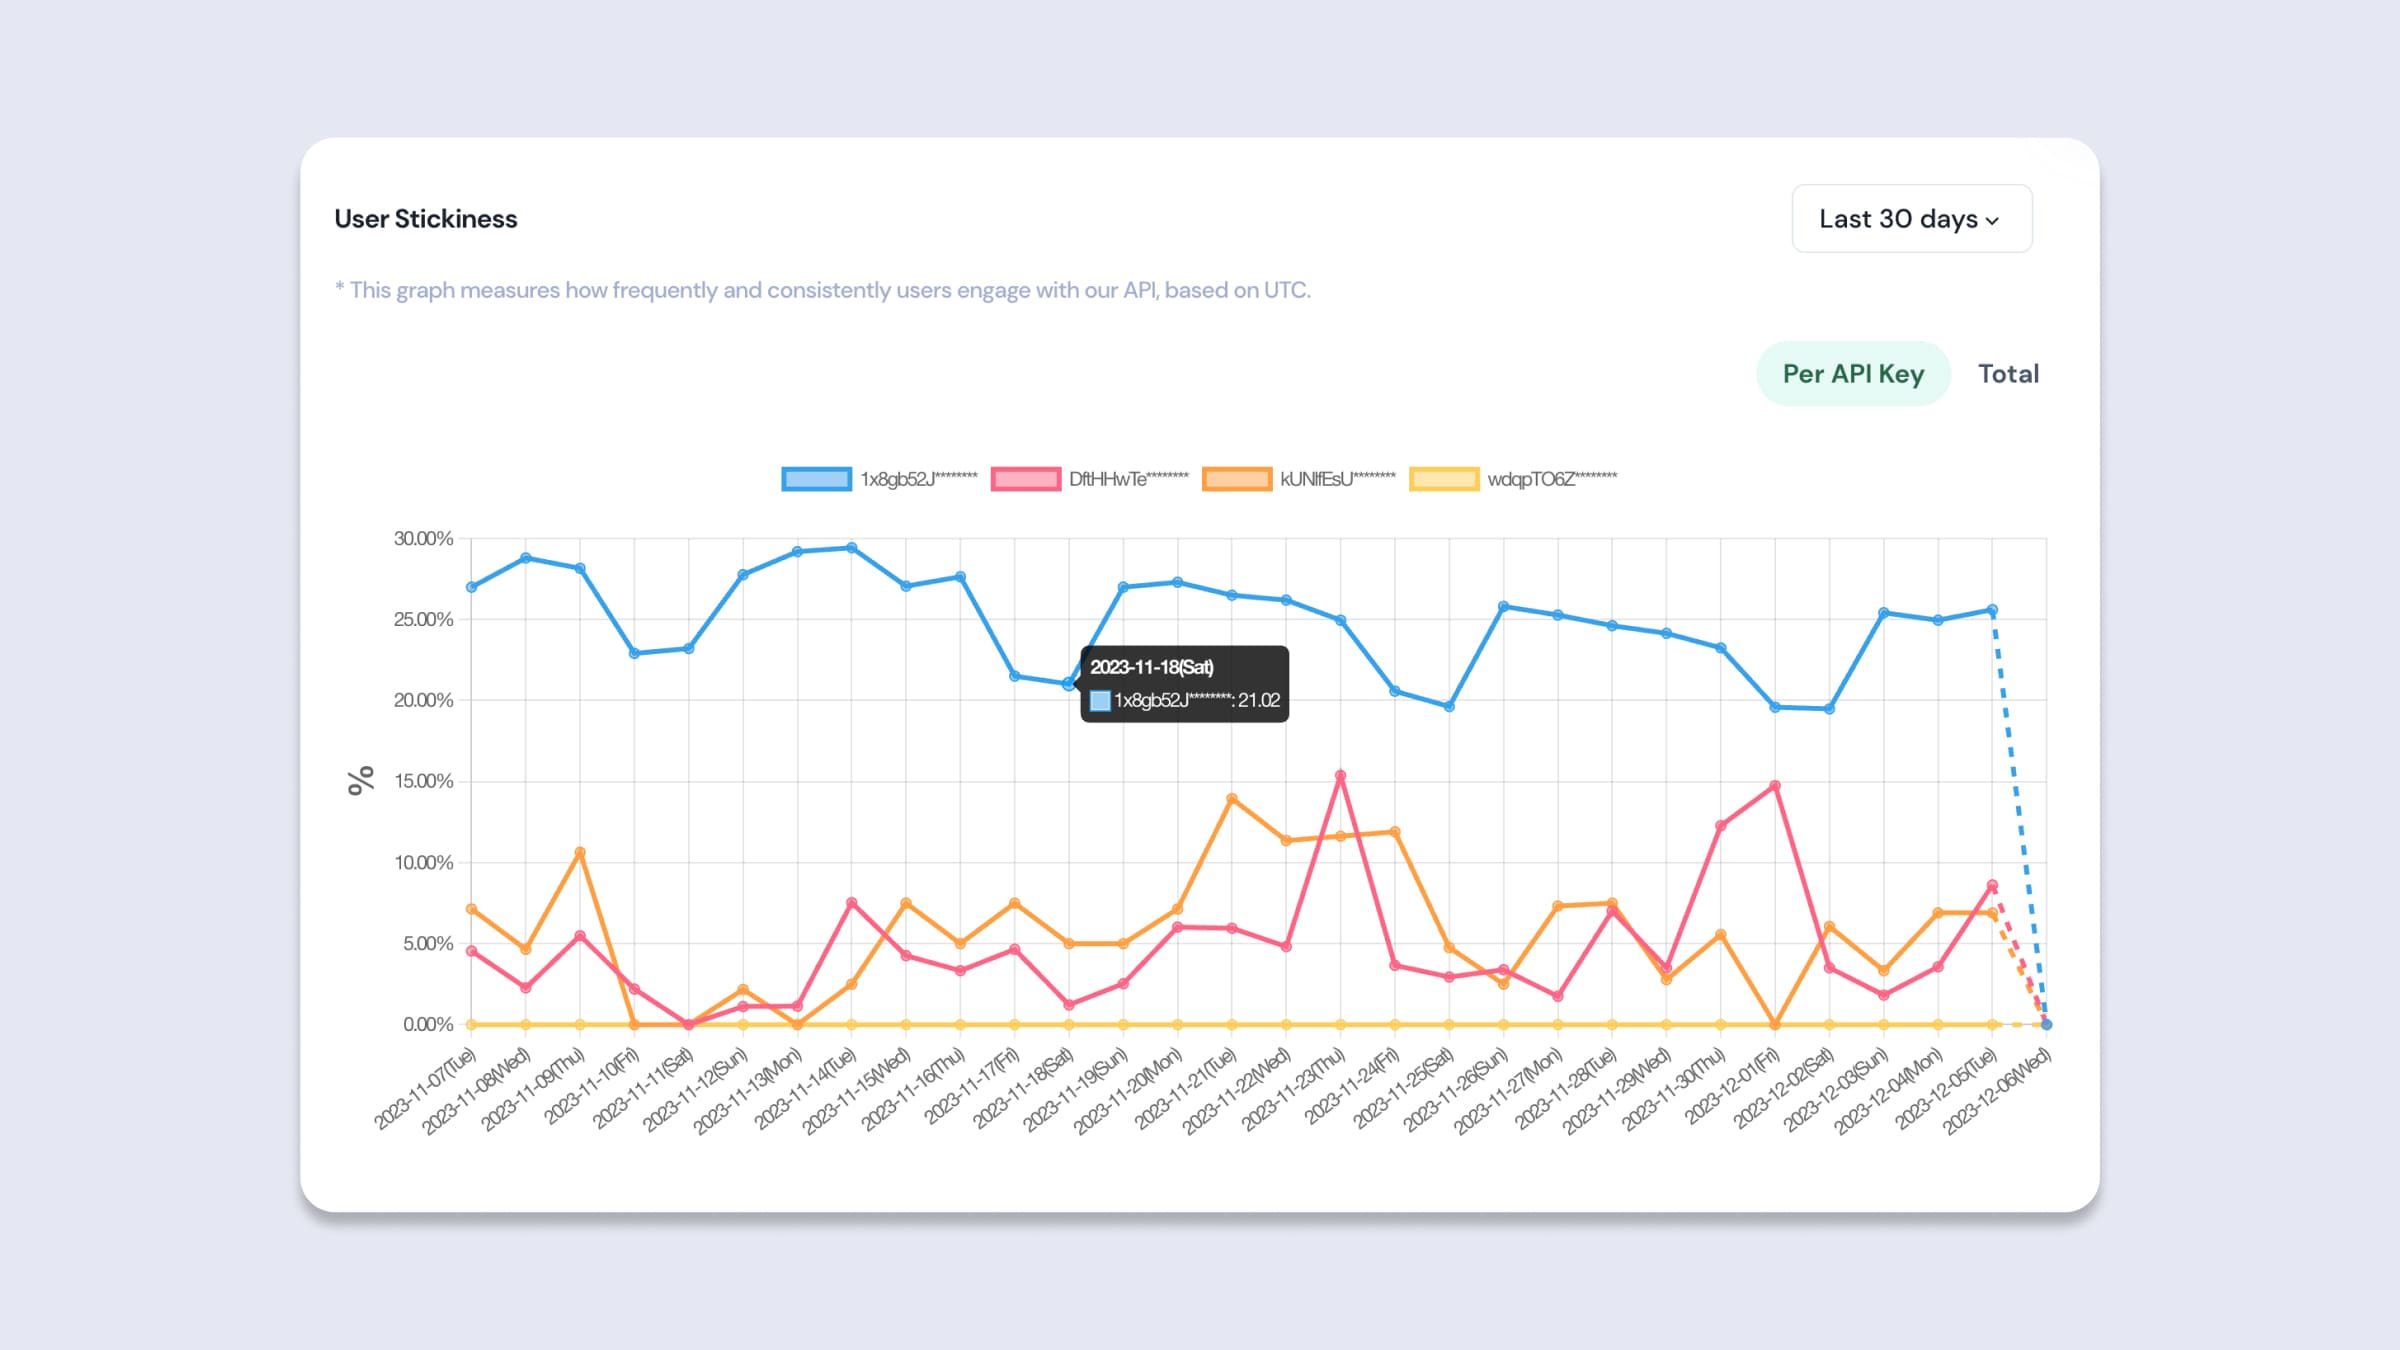
User Stickiness
Description
- The User Stickiness graph shows the ratio of Daily Active Users (DAU) to Monthly Active Users (MAU). This allows you to gauge how frequently and consistently users engage with the service.
- A high stickiness ratio indicates that users have a strong interest and loyalty towards the service. This graph provides key insights into the service's user retention and engagement, offering valuable information for strategic marketing and product improvement directions.
- Data is aggregated once a day based on UTC time (KST-9). Thus, users can review the Stickiness of the previous day based on UTC the following day.
- Hovering over each data point on the graph will reveal the exact number of users for that particular day.
- Users who made invalid API calls are also included in this tally.
User Stickiness
- Date
You can choose the period you want to view. If there's no adjustment, the most recent month from the current date will be displayed.- Last 7 days: You can view the stickiness data for the most recent 7 days from the current date.
- Last 15 days: You can view the stickiness data for the most recent 15 days from the current date.
- Last 30 days: You can view the stickiness data for the most recent 30 days from the current date.
- Last 3 months: You can view the stickiness data for the most recent 3 months from the current date.
- Custom: You can directly select the period of stickiness data you want to view from the calendar. The date selection is available up to a maximum of one month.
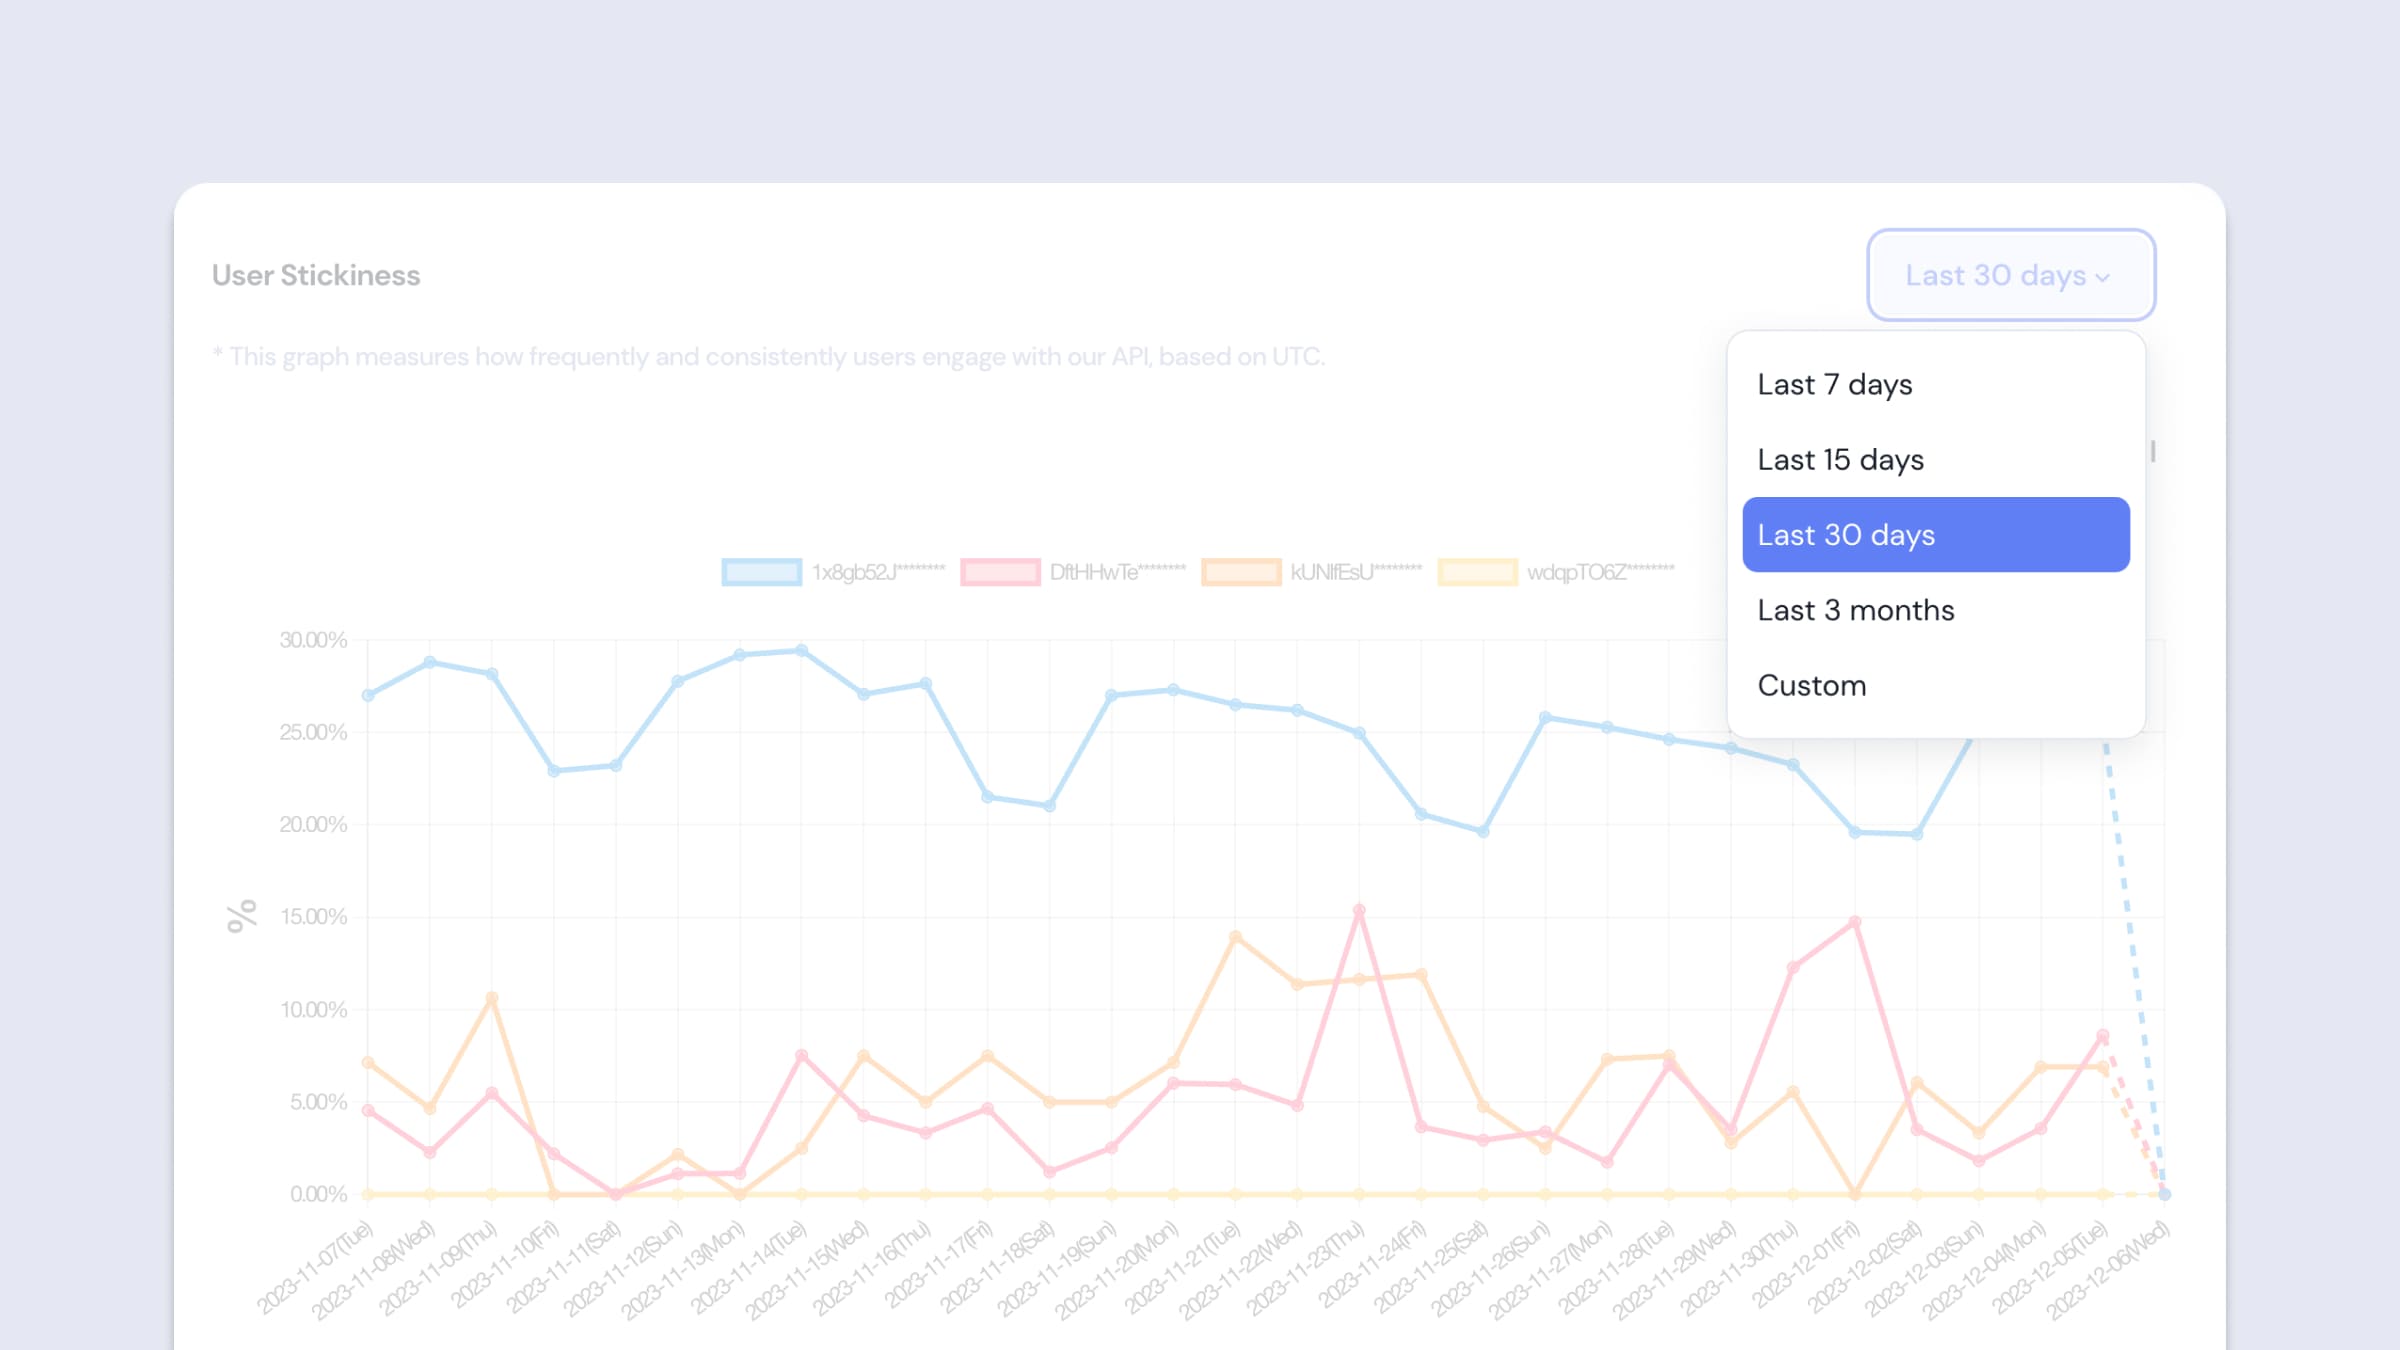
User Stickiness Filter - Date
- Per API Key / Total
If you have more than one API Key, you can view the data separated by each API Key or view the combined data of all. If you only have one API Key, you will see the same data.- Per API Key: You can view the API usage data separated by each API Key. By clicking on the graph legend, you can also select and view data for the desired API Key only.
- Total: Displays the combined data of all API Keys.
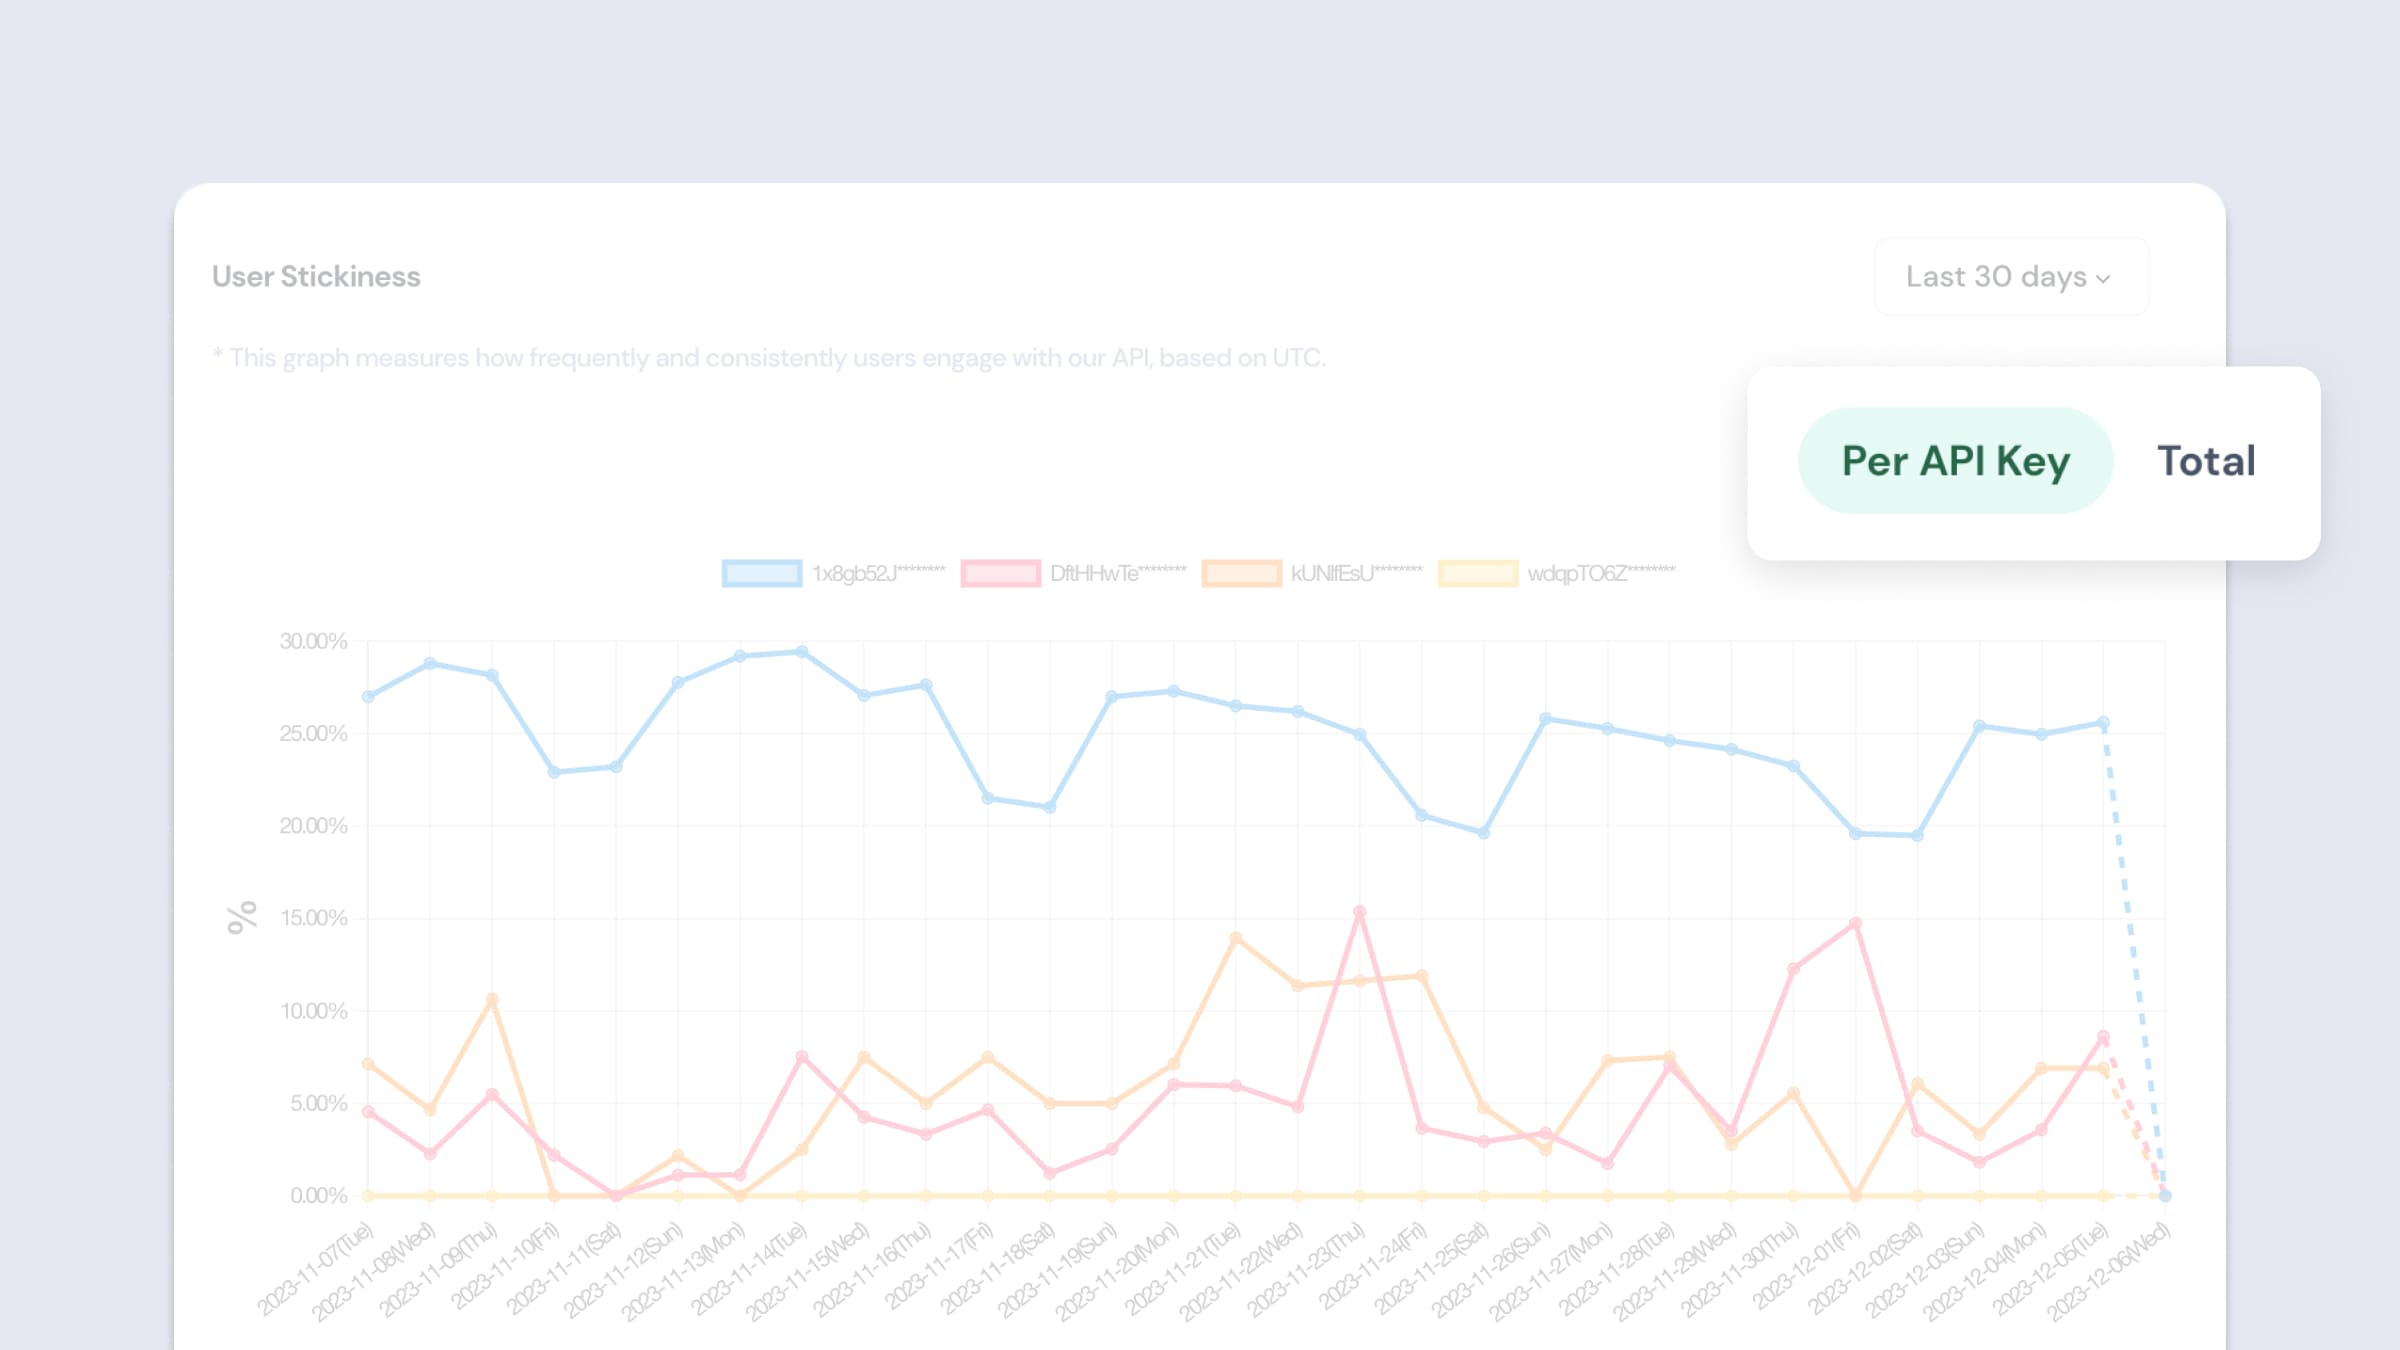
User Stickiness Filter - API Key
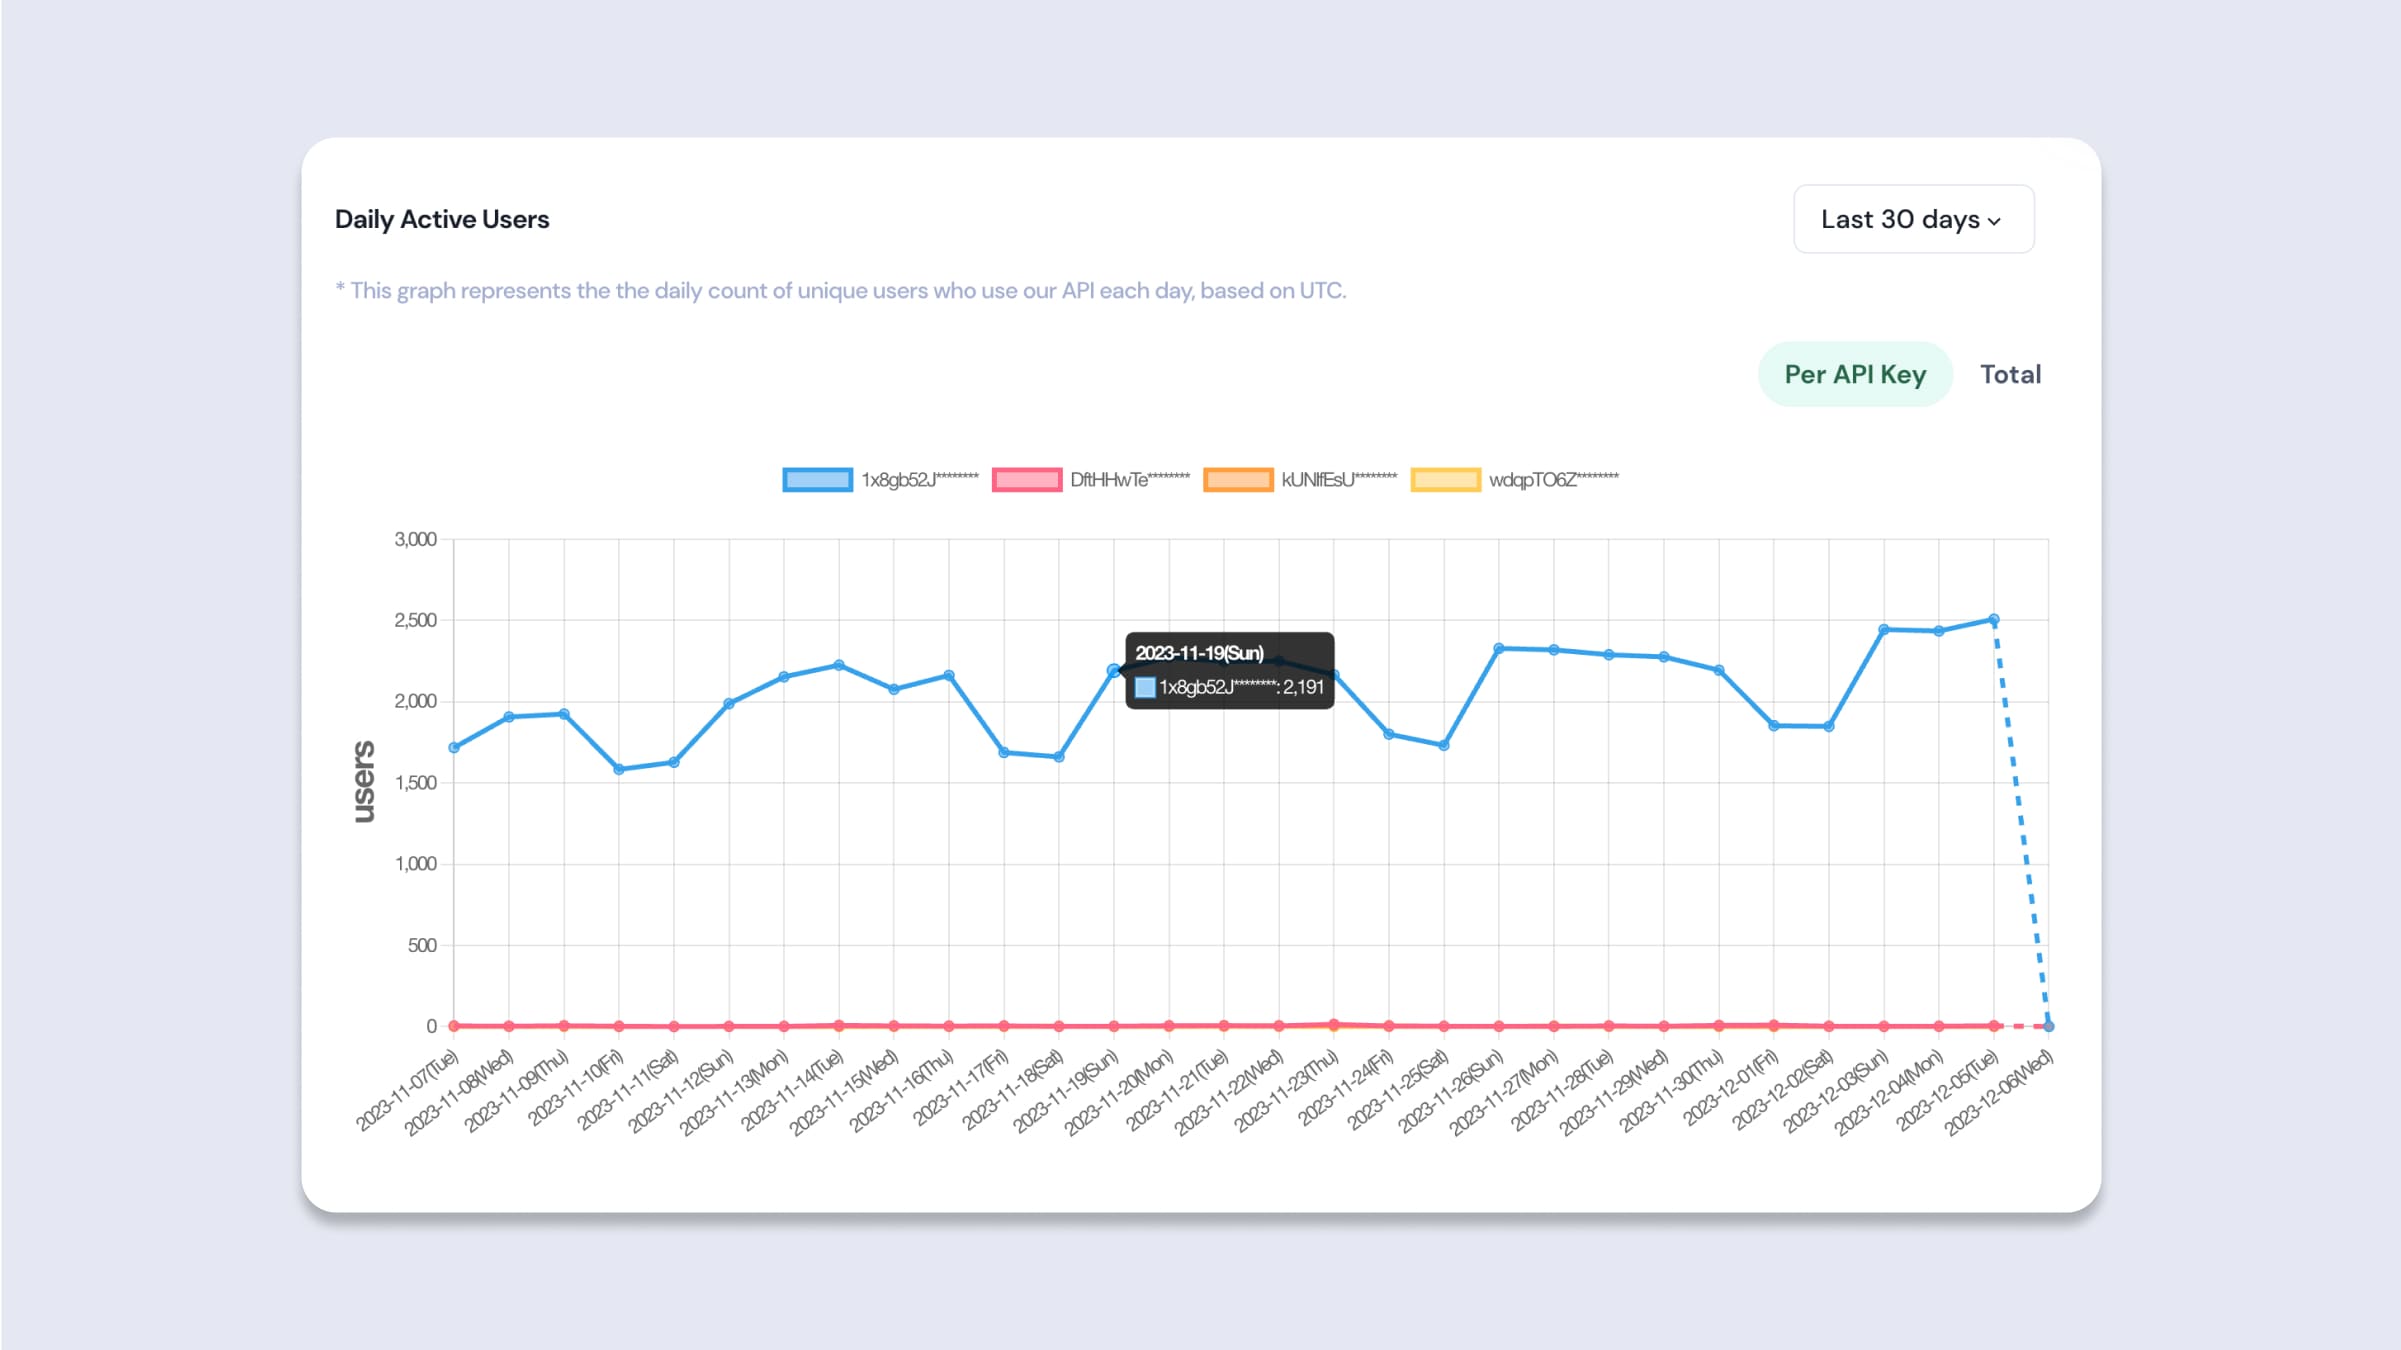
Daily Active Users
Description
- The Daily Active Users (DAU) graph represents the number of users who have utilized the API within a day. Through this, one can easily grasp daily activity patterns and trending behaviors of users interacting with the API.
- This visualization allows stakeholders to swiftly gauge key metrics such as the service growth rate, user engagement, and peaks in usage on specific days or weekdays.
- Data is aggregated once a day based on UTC time (KST-9). Thus, users can review the DAU of the previous day based on UTC the following day.
- Hovering over each data point on the graph will reveal the exact number of users for that particular day.
- Users who made invalid API calls are also included in this tally.
Daily Active Users Chart
Filters
- Date
You can select the desired period for review. By default, data from the last month up to the current moment is displayed.- Last 7 days: You can view the DAU data for the last 7 days counting from the current date.
- Last 15 days: DAU data for the last 15 days counting from the current date is available.
- Last 30 days: You can view the DAU data for the last 30 days from the current date.
- Last 3 months: You can view the DAU data for the most recent 3 months from the current date.
- Custom: Choose your desired date range for DAU data directly from the calendar. You can select up to a maximum of one month.
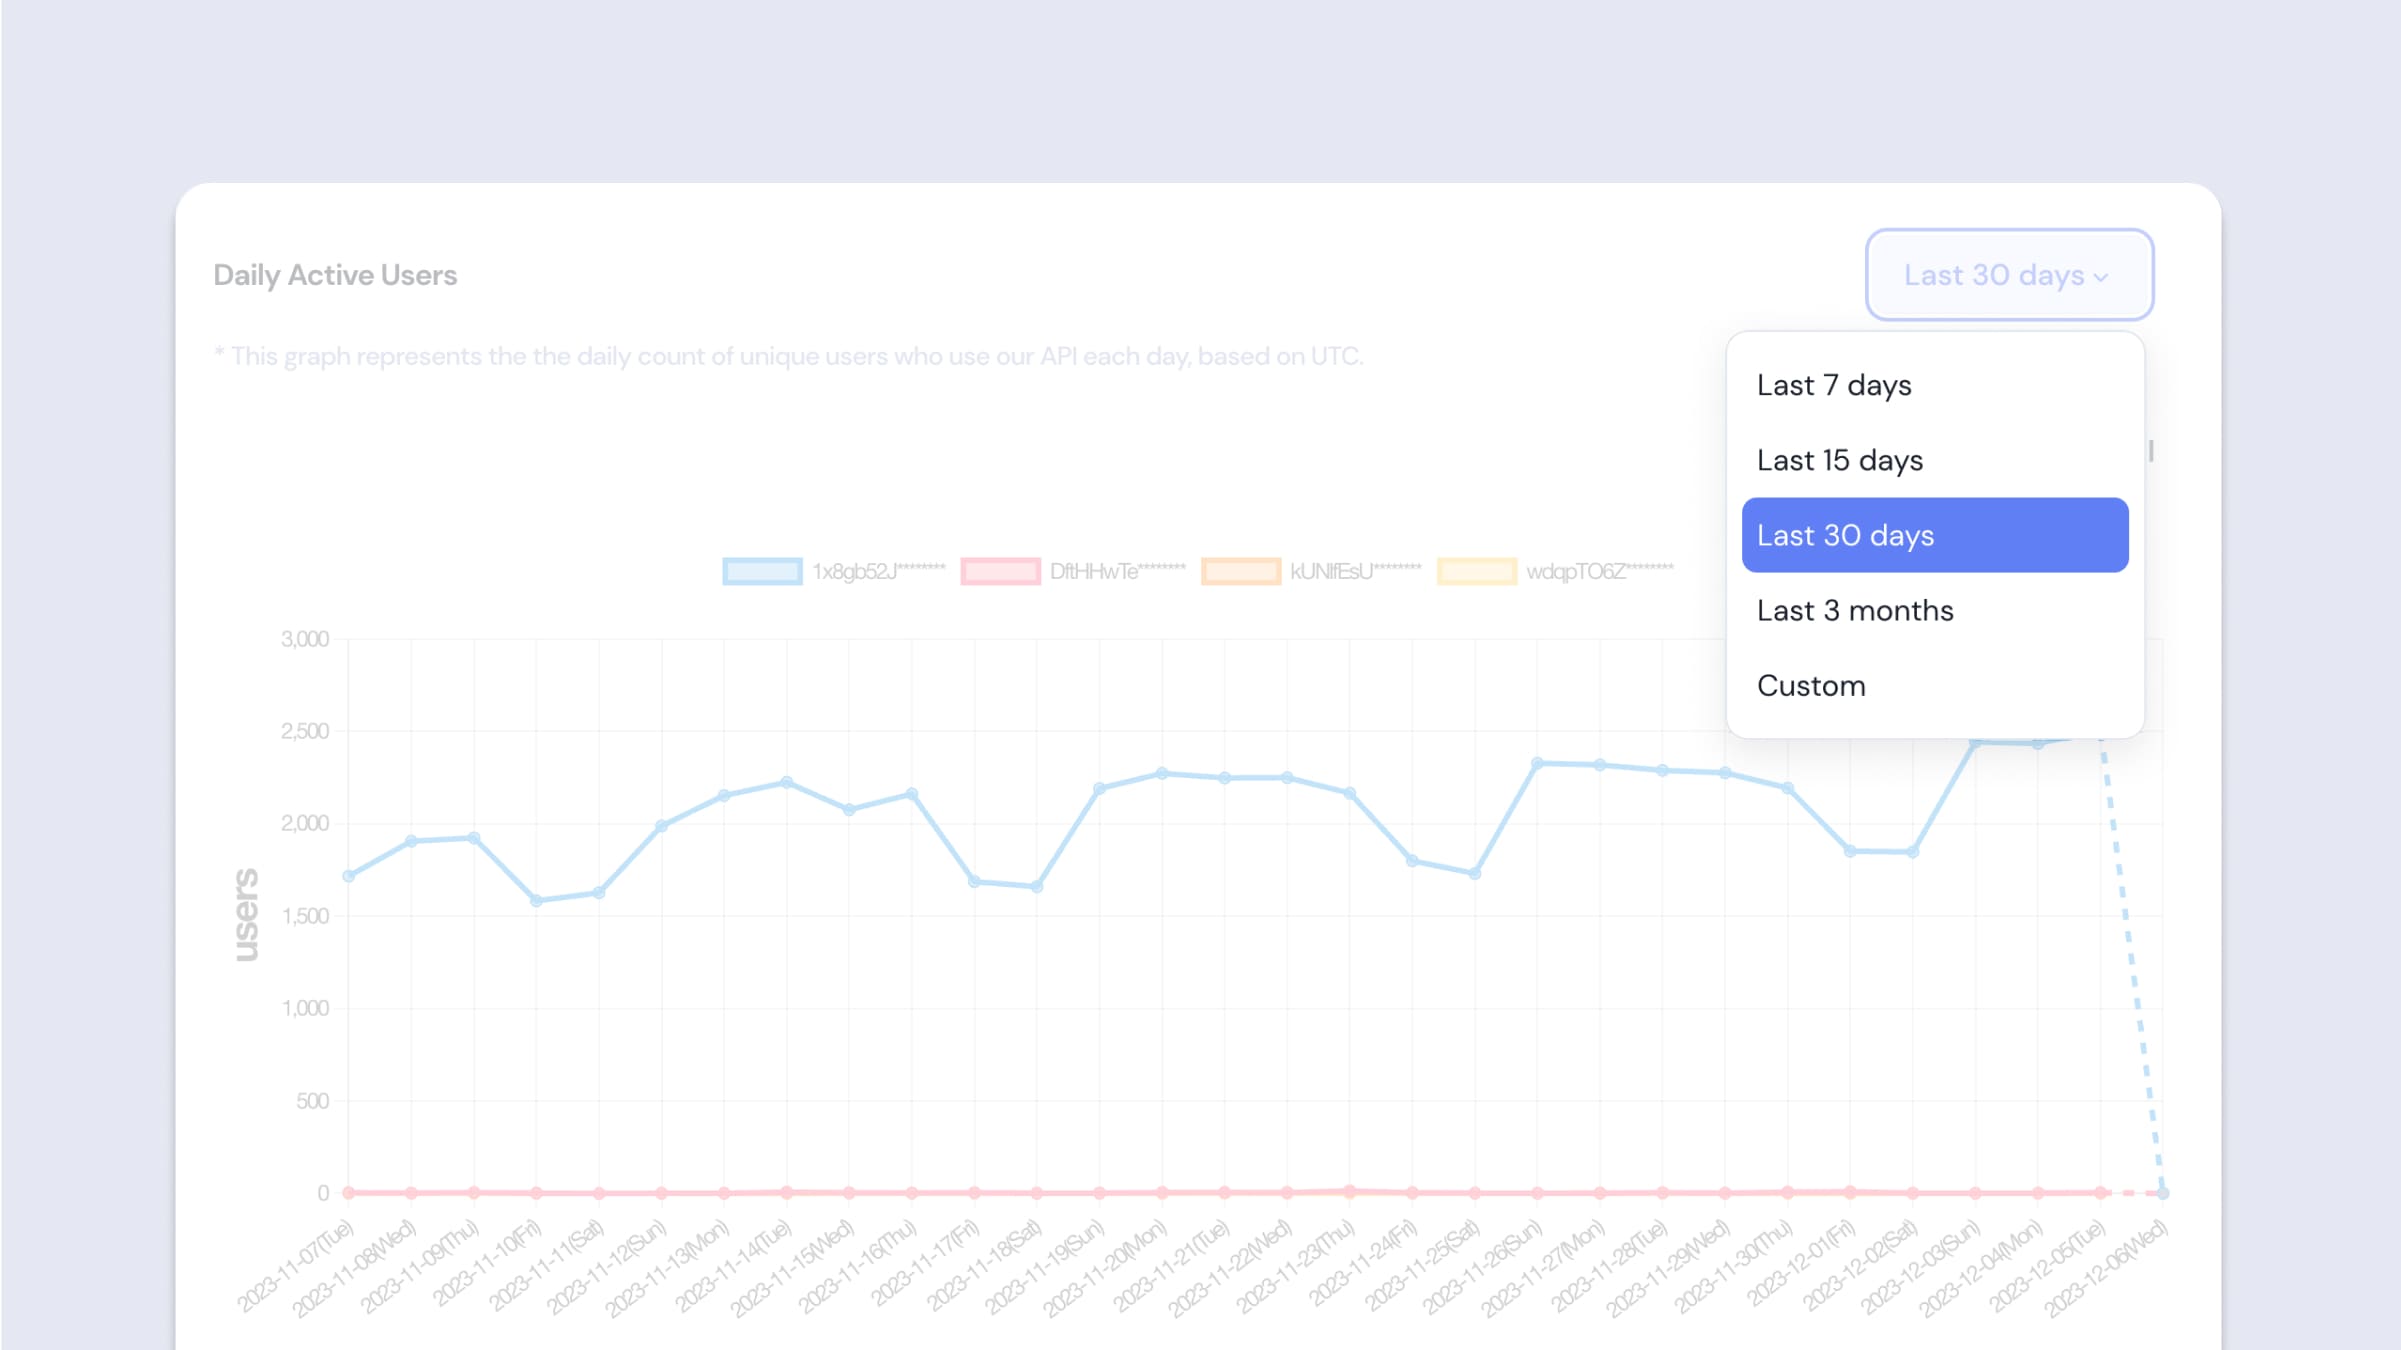
Daily Active Users Filter - Date
- Per API Key / Total
If you have more than one API Key, you can view the DAU information either separated by each API Key or as a combined total. If you only have one API Key, you will see the data corresponding to that single key.- Per API Key: You can view DAU data separated by each API Key. By clicking on the graph legend, you can selectively view data for your desired API Key.
- Total: The aggregated DAU data from all API Keys is displayed.
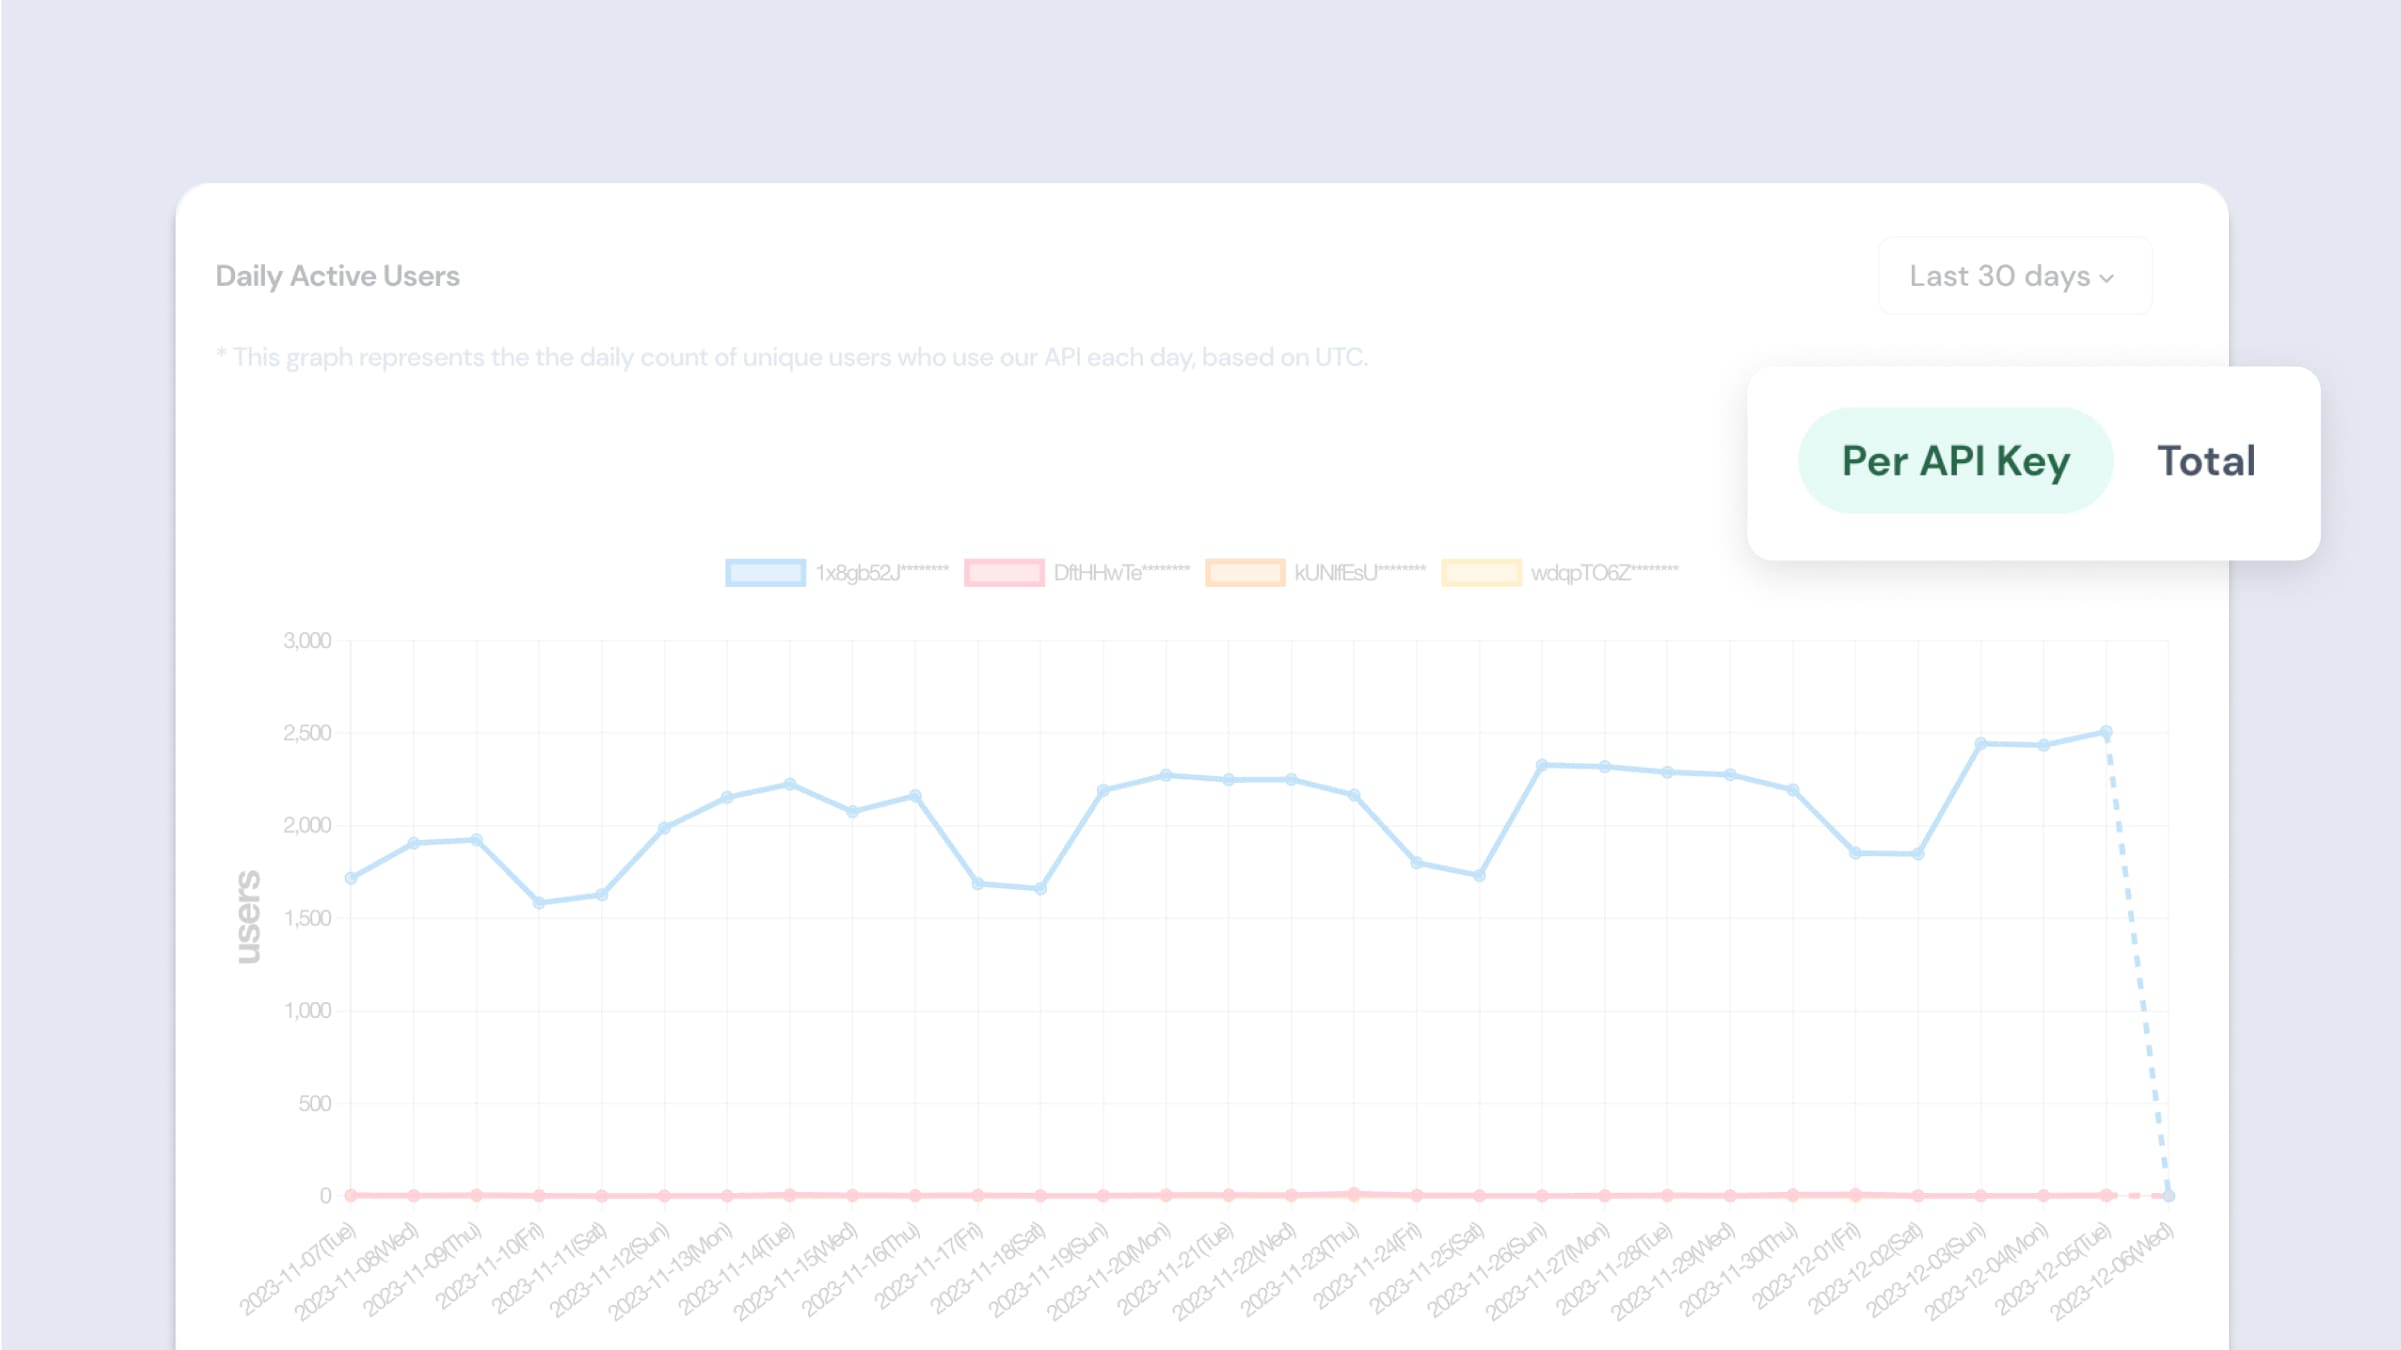
Daily Active Users Filter - API Key
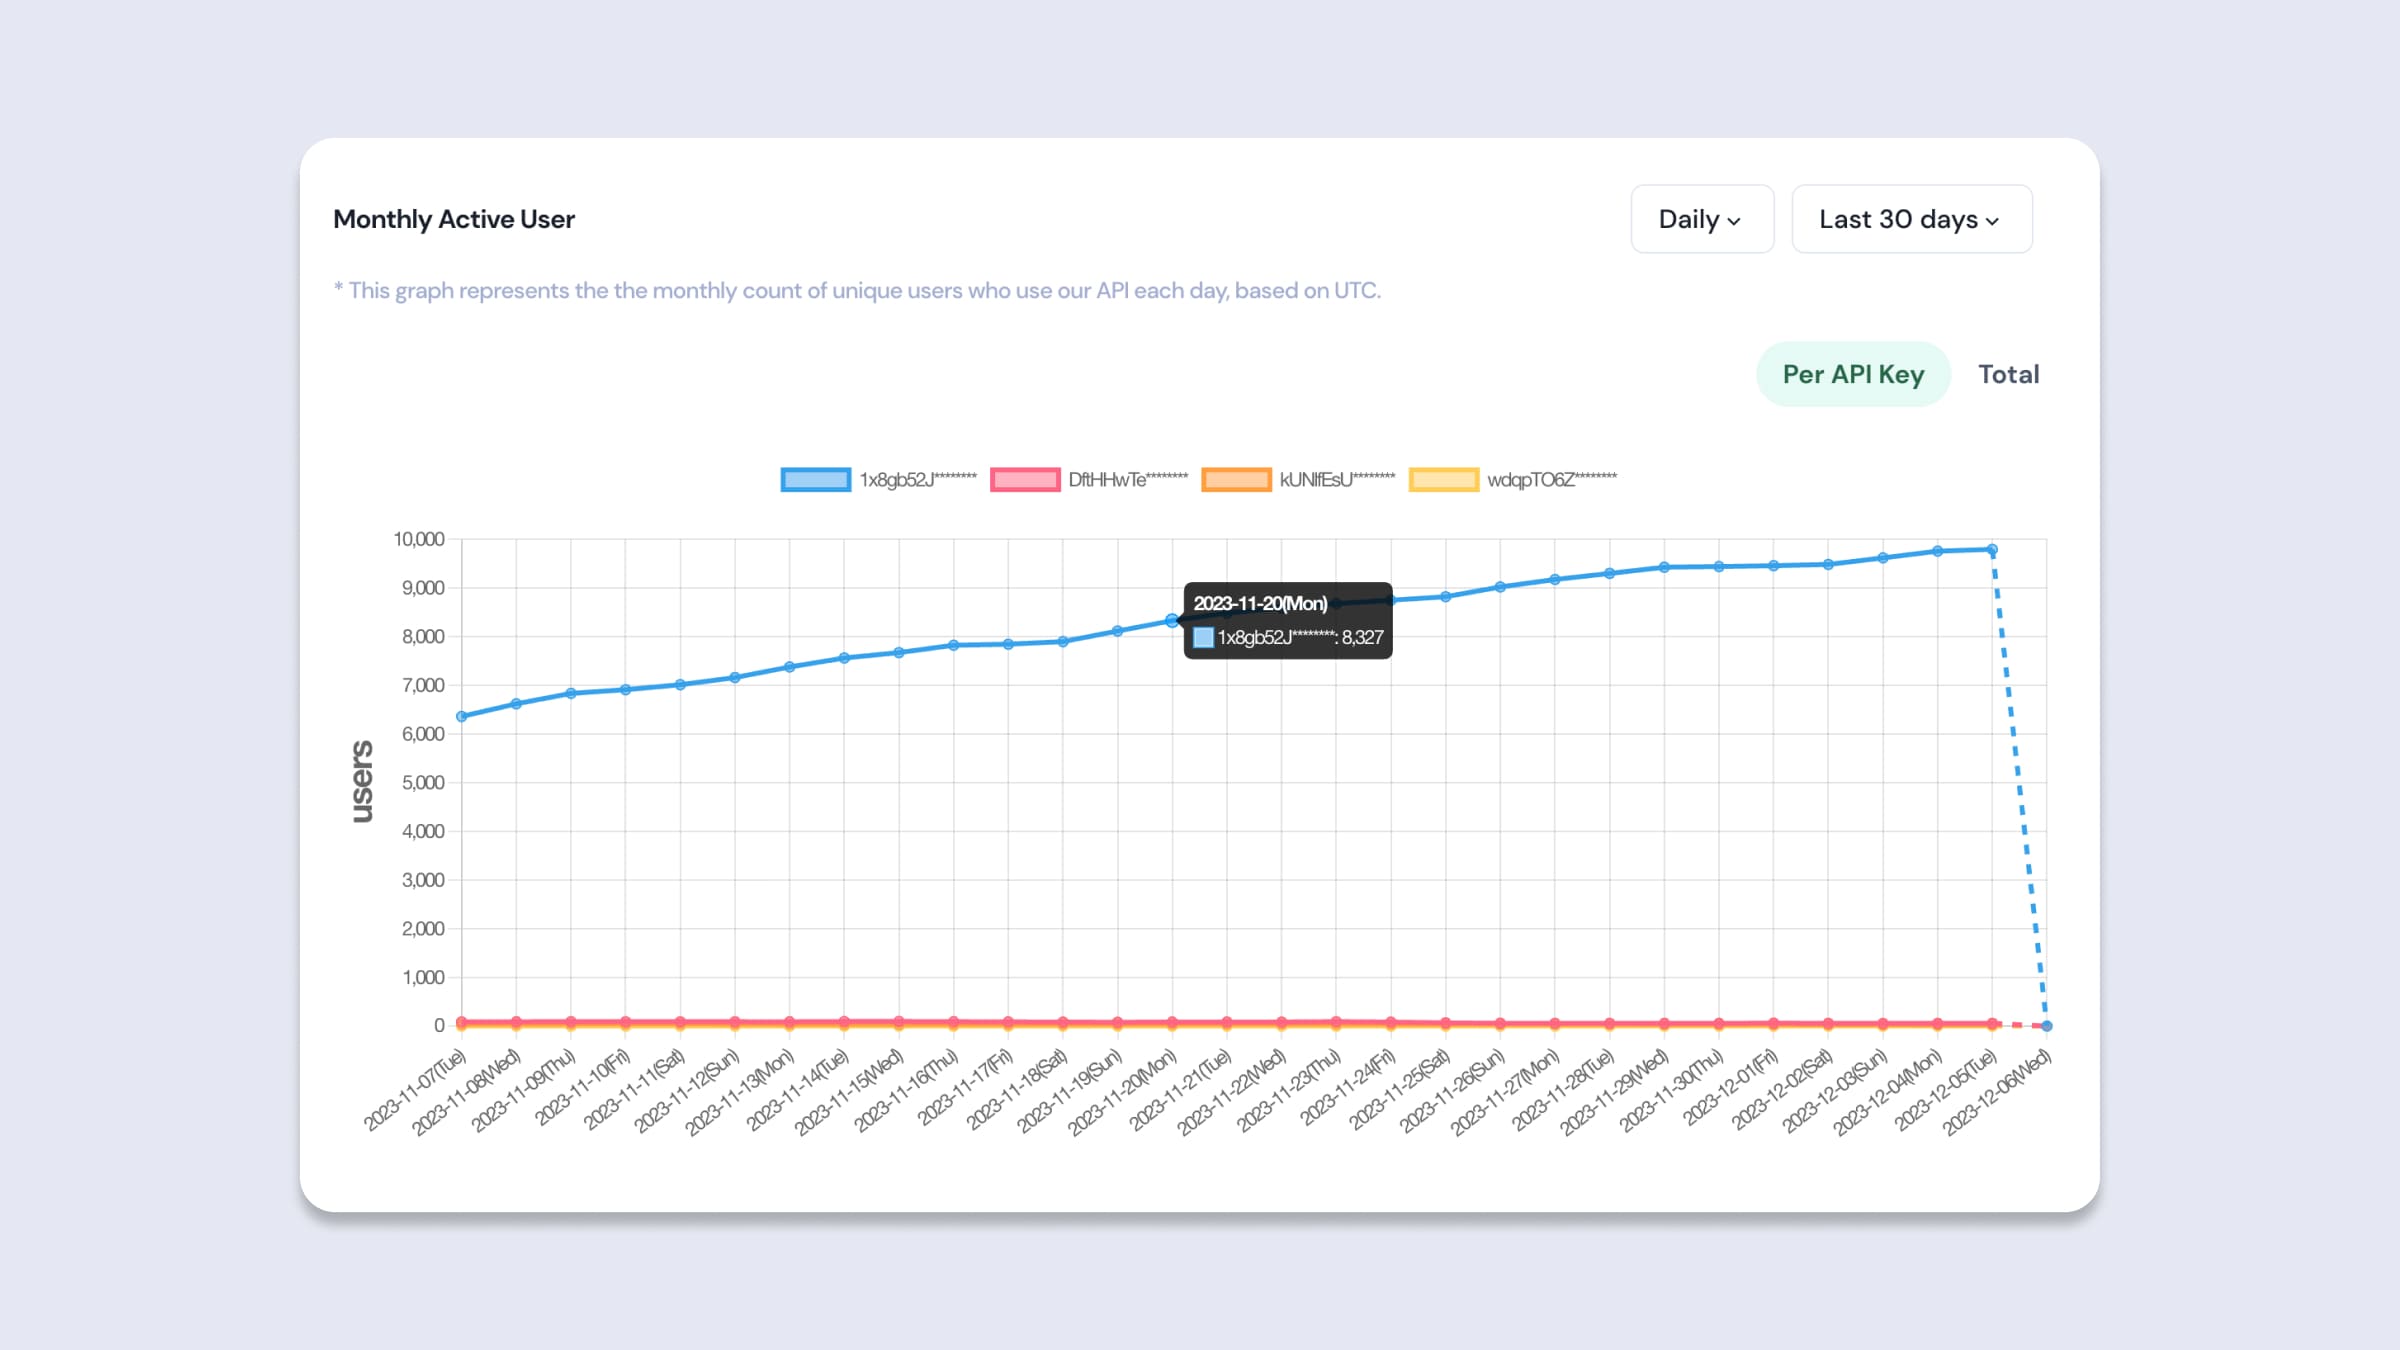
Monthly Active User
Description
- The Monthly Active Users (MAU) graph shows the number of unique users who have used the API in the last 30 days.
- This graph allows you to understand the changes and trends in monthly user engagement and is useful for analyzing the long-term growth rate and user loyalty of the service. MAU data is a crucial indicator for gauging the scalability and sustainability of the service, providing essential information for establishing strategies for user base growth and retention.
- Data is aggregated once a day based on UTC time (KST-9). Thus, users can review the MAU of the previous day based on UTC the following day.
- Hovering over each data point on the graph will reveal the exact number of users for that particular day.
- Users who made invalid API calls are also included in this tally.
Monthly Active User Chart
Filters
- Period
You can select the unit of time for the period you want to query.- Daily: Allows you to view MAU data on a daily basis.
- Monthly: This enables you to view MAU data on a monthly basis.
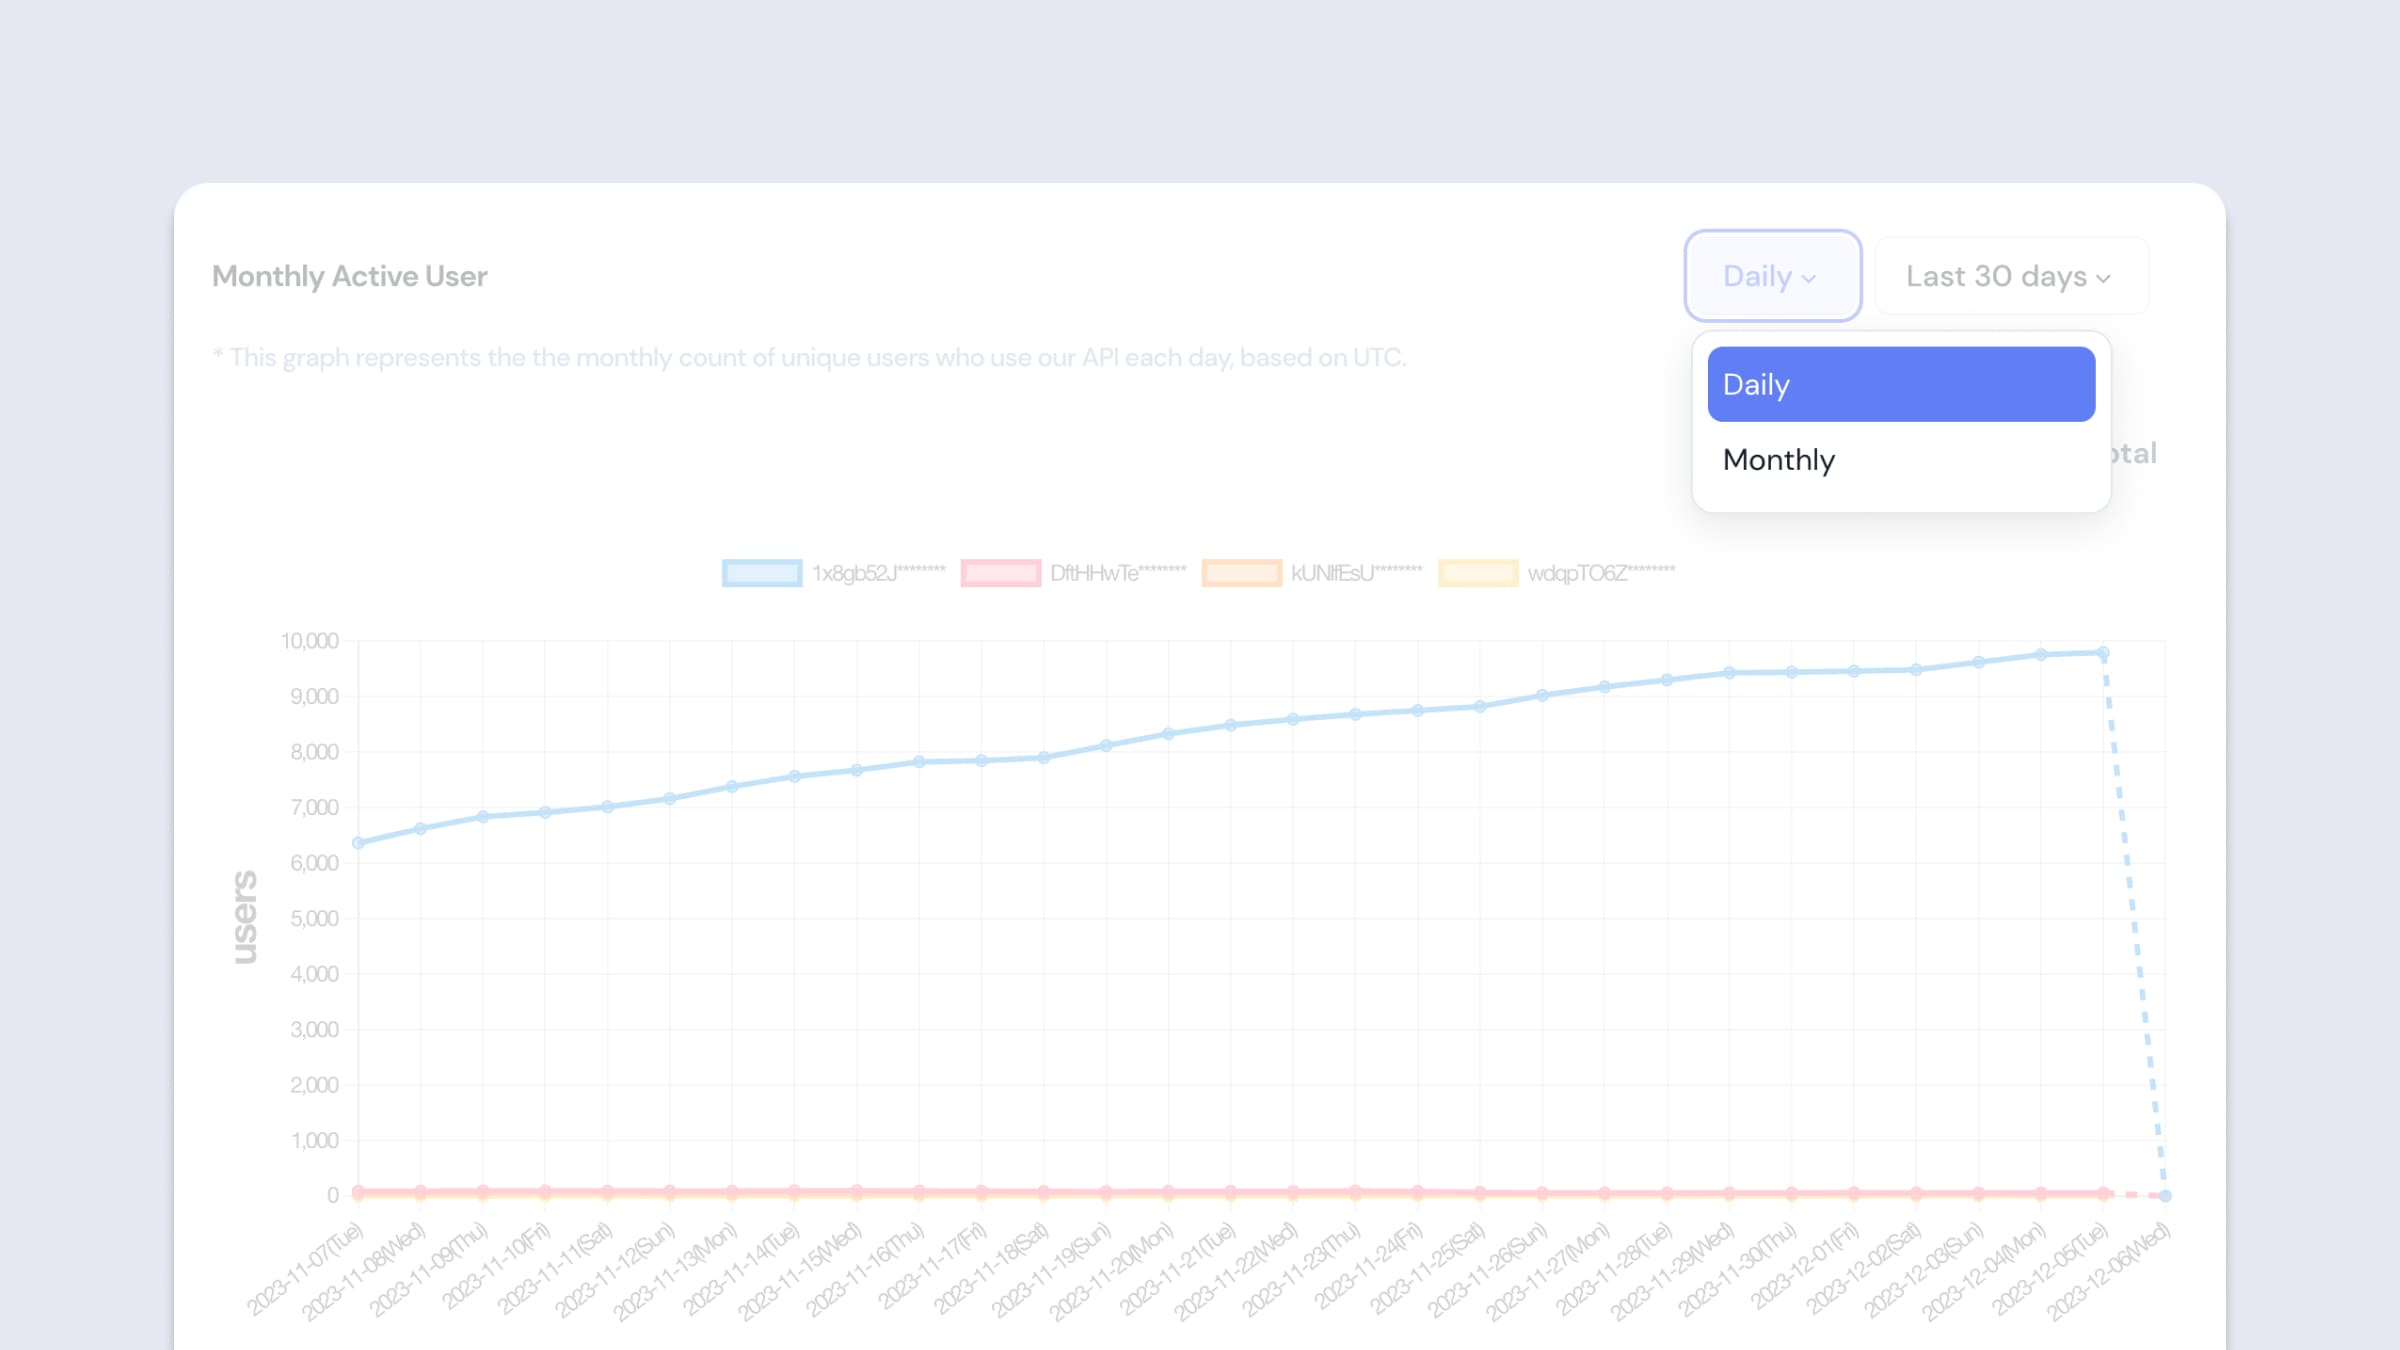
Monthly Active User filter - Period
- Date
You can select the desired period for review. By default, data from the last month up to the current moment is displayed.- Last 7 days: You can view the MAU data for the last 7 days counting from the current date.
- Last 15 days: MAU data for the last 15 days counting from the current date is available.
- Last 30 days: You can view the MAU data for the last 30 days from the current date.
- Last 3 months: You can view the MAU data for the most recent 3 months from the current date.
- Last 6 months: You can view the MAU data for the most recent 6 months from the current date.
- Custom: Choose your desired date range for MAU data directly from the calendar. You can select up to a maximum of one month.
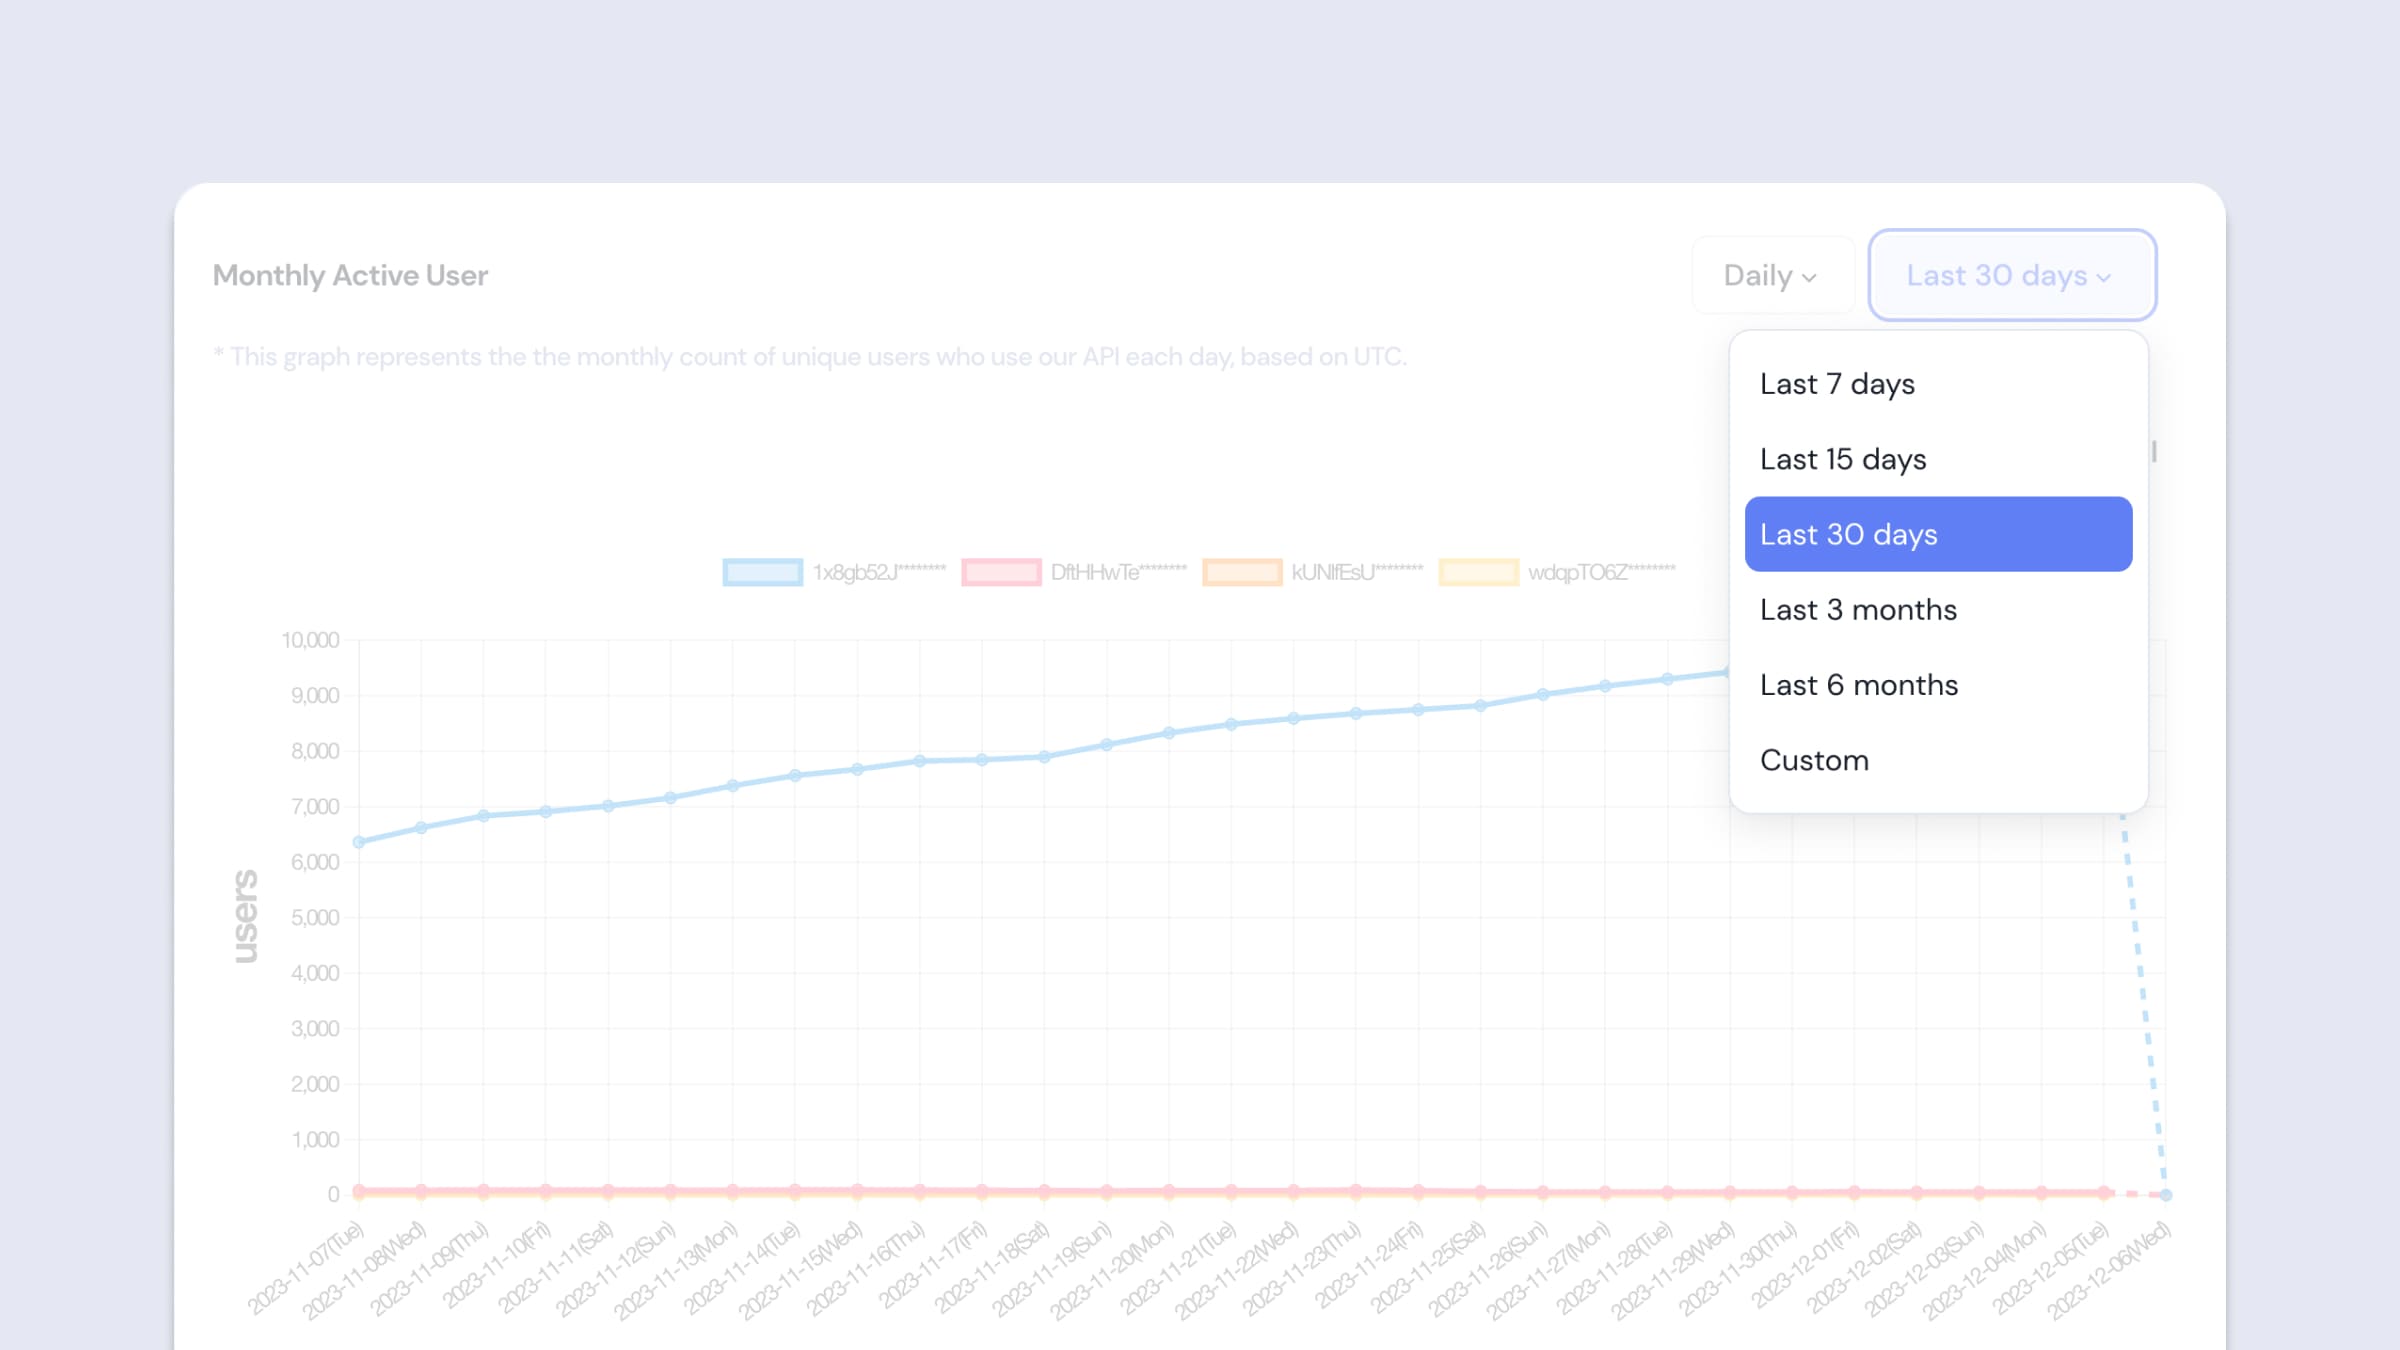
Monthly Active User filter - Date
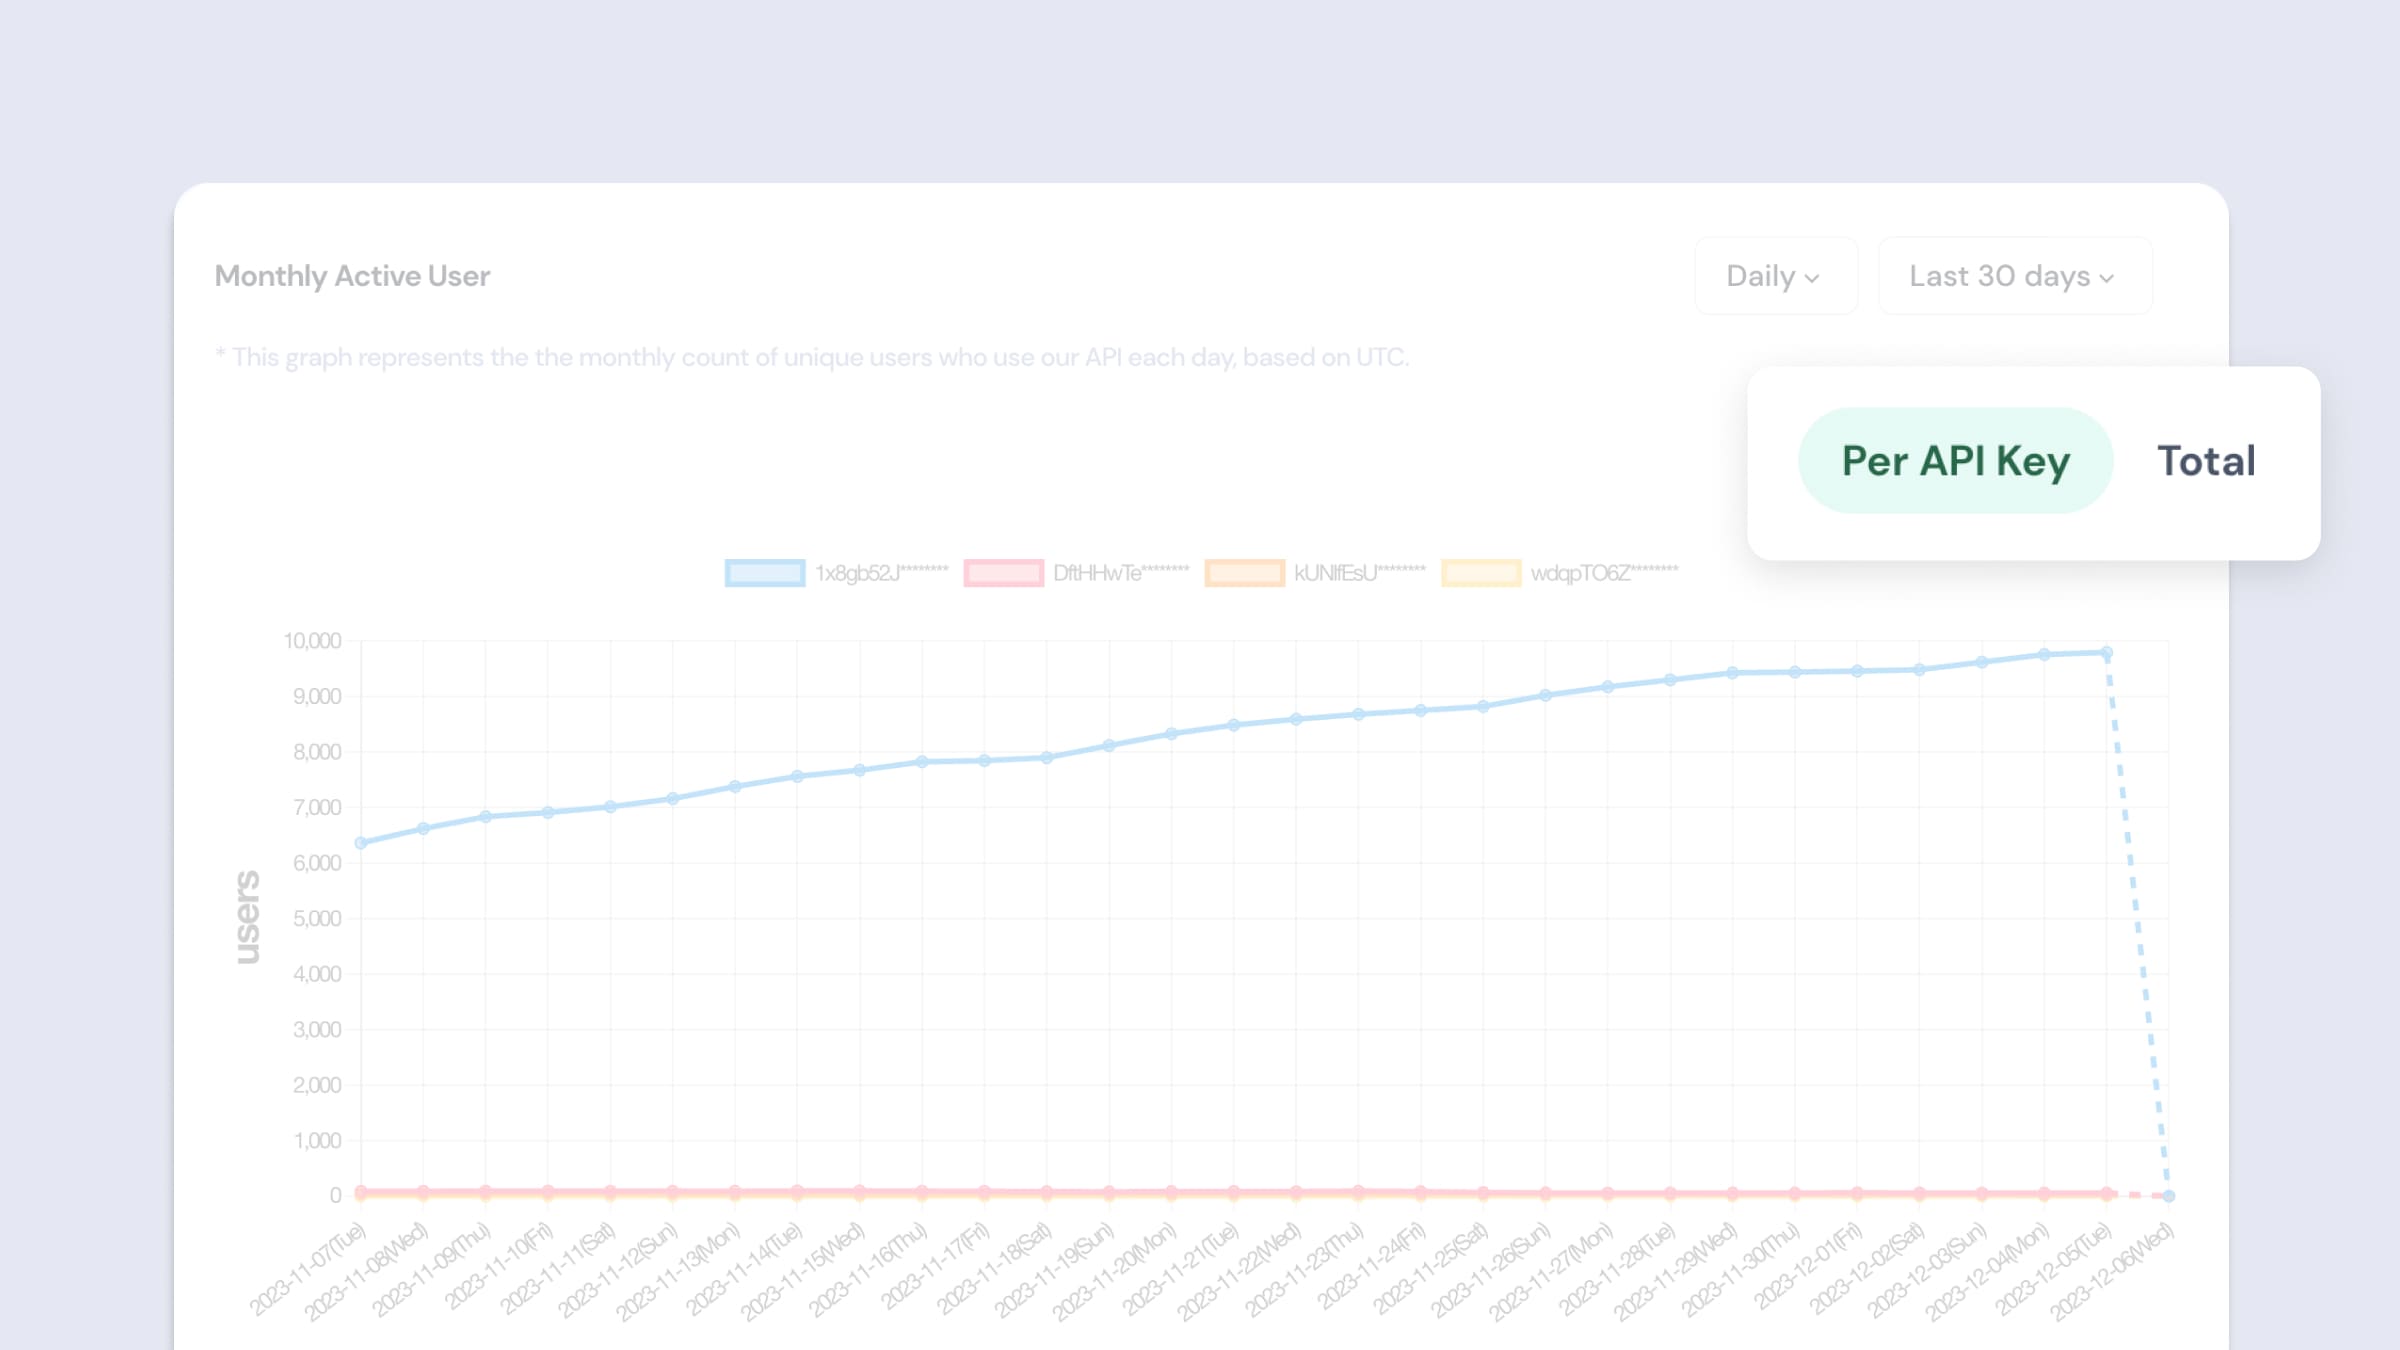
- Per API Key / Total
If you have more than one API Key, you can view the data separated by each API Key or view the combined data of all. If you only have one API Key, you will see the same data.- Per API Key: You can view the API usage data separated by each API Key. By clicking on the graph legend, you can also select and view data for the desired API Key only.
- Total: Displays the combined data of all API Keys.
Monthly Active User Filter - API Key