
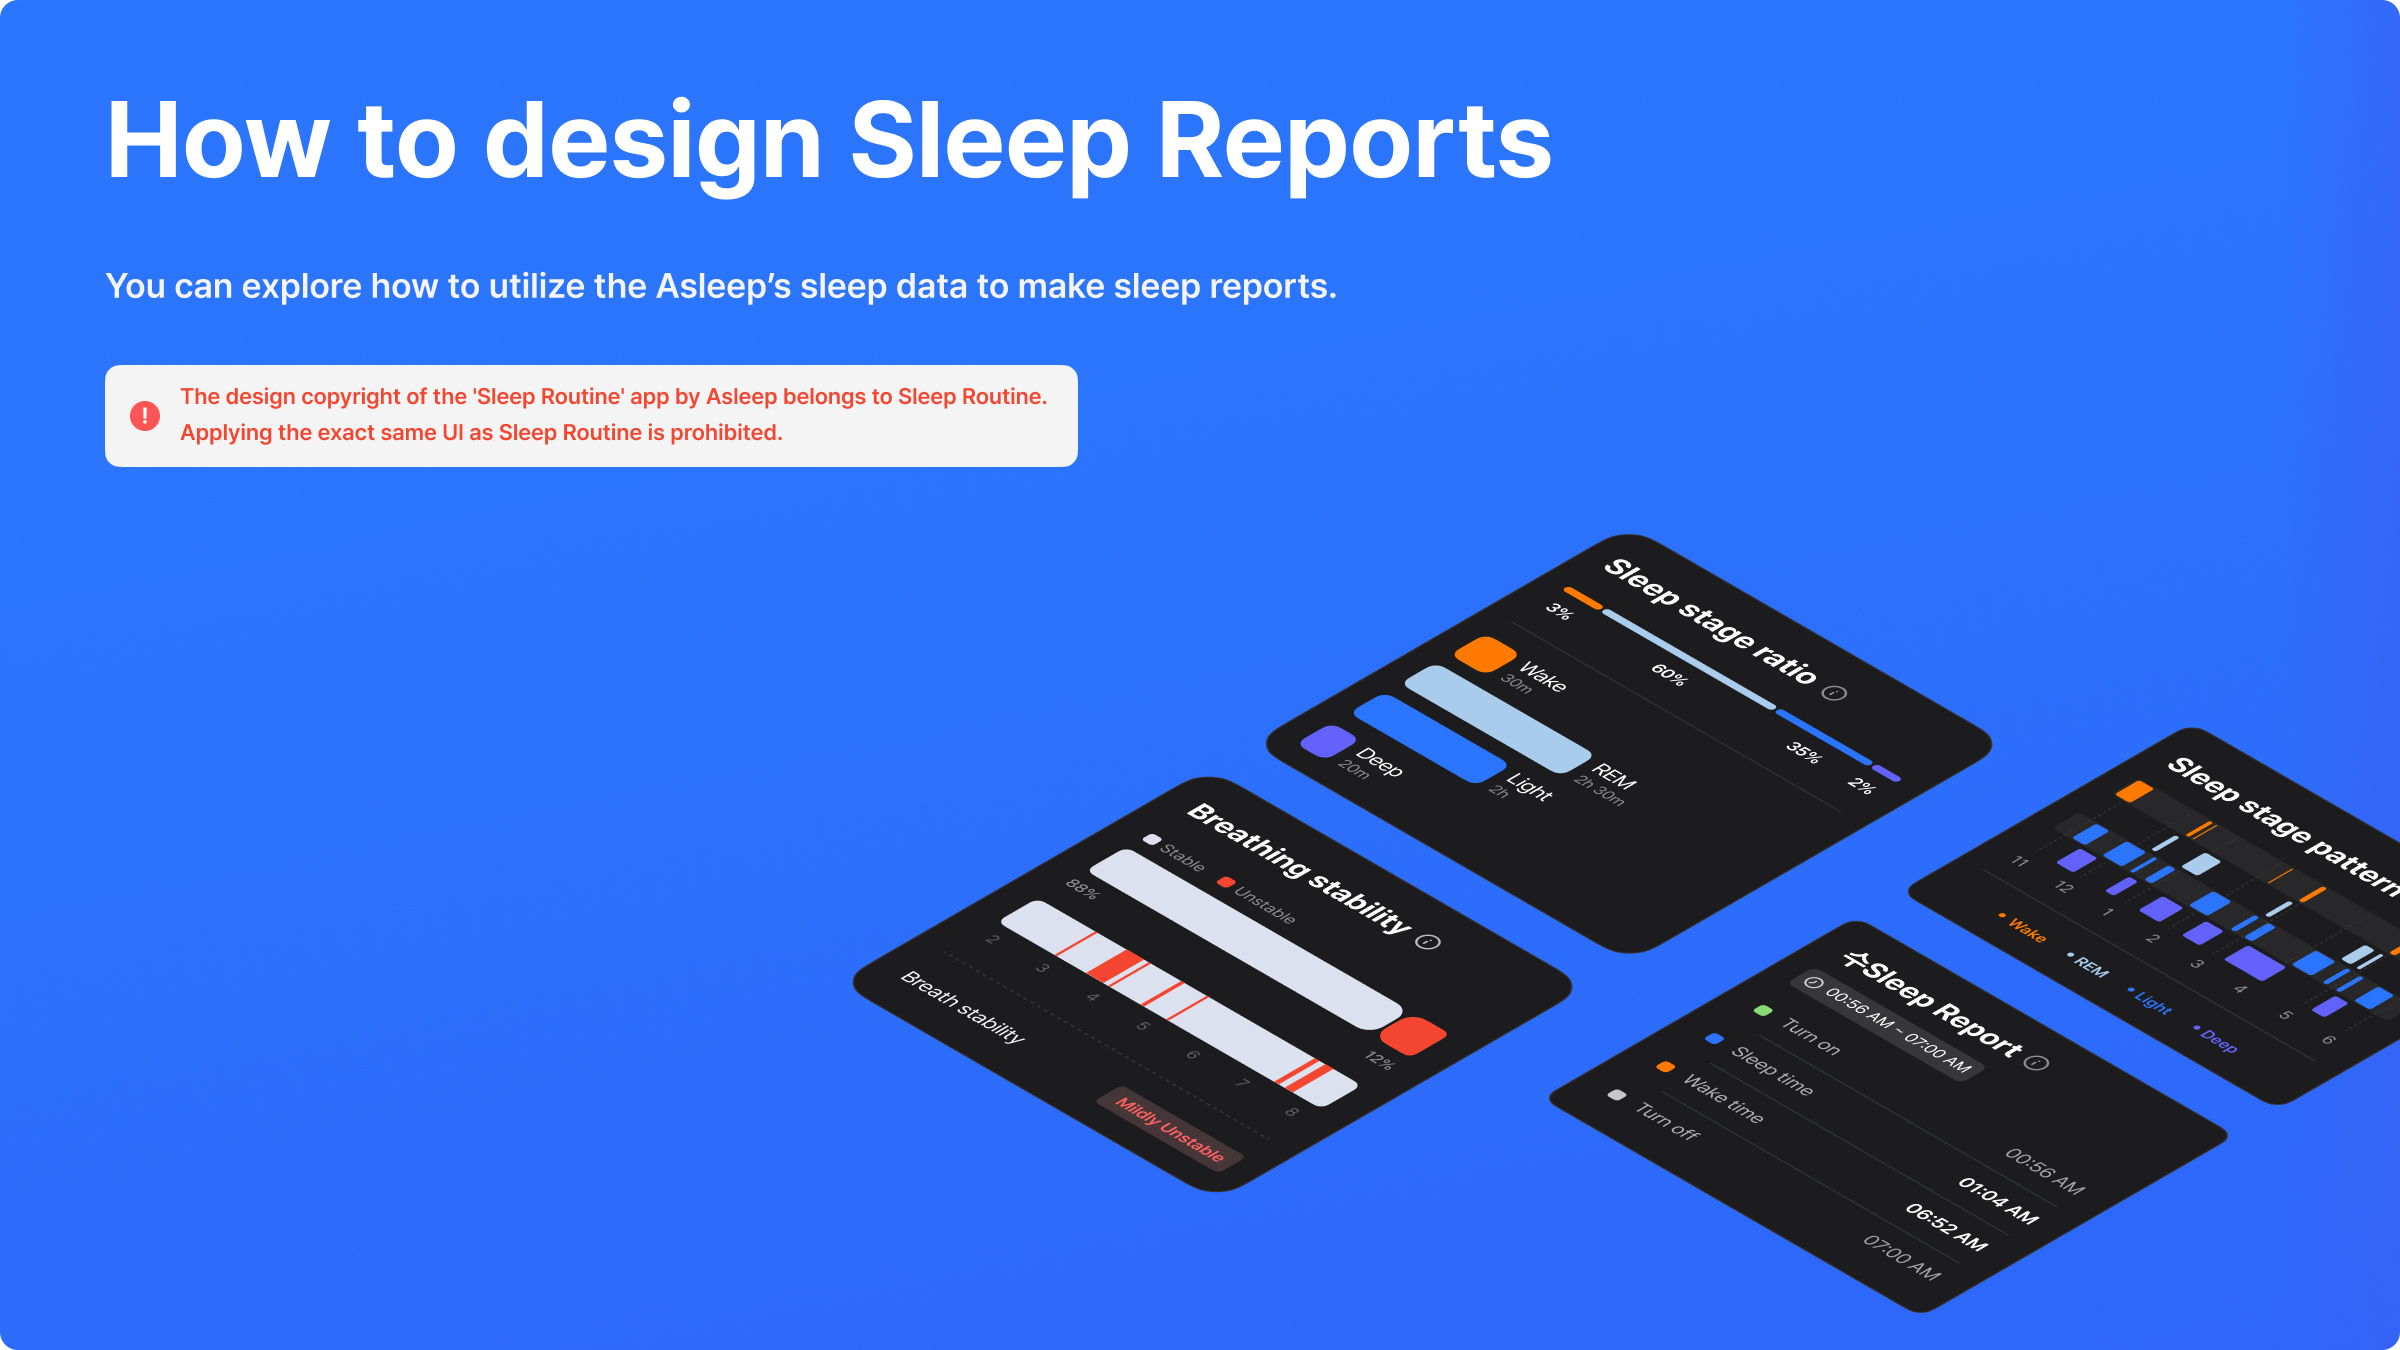
Sleep Report Design Guide
Discover how to design Sleep Report utilizing Asleep data
Starting to design a sleep report can be daunting.
But don't worry! We'll explain how you can visualize Asleep's sleep data into a sleep report for easy understanding.
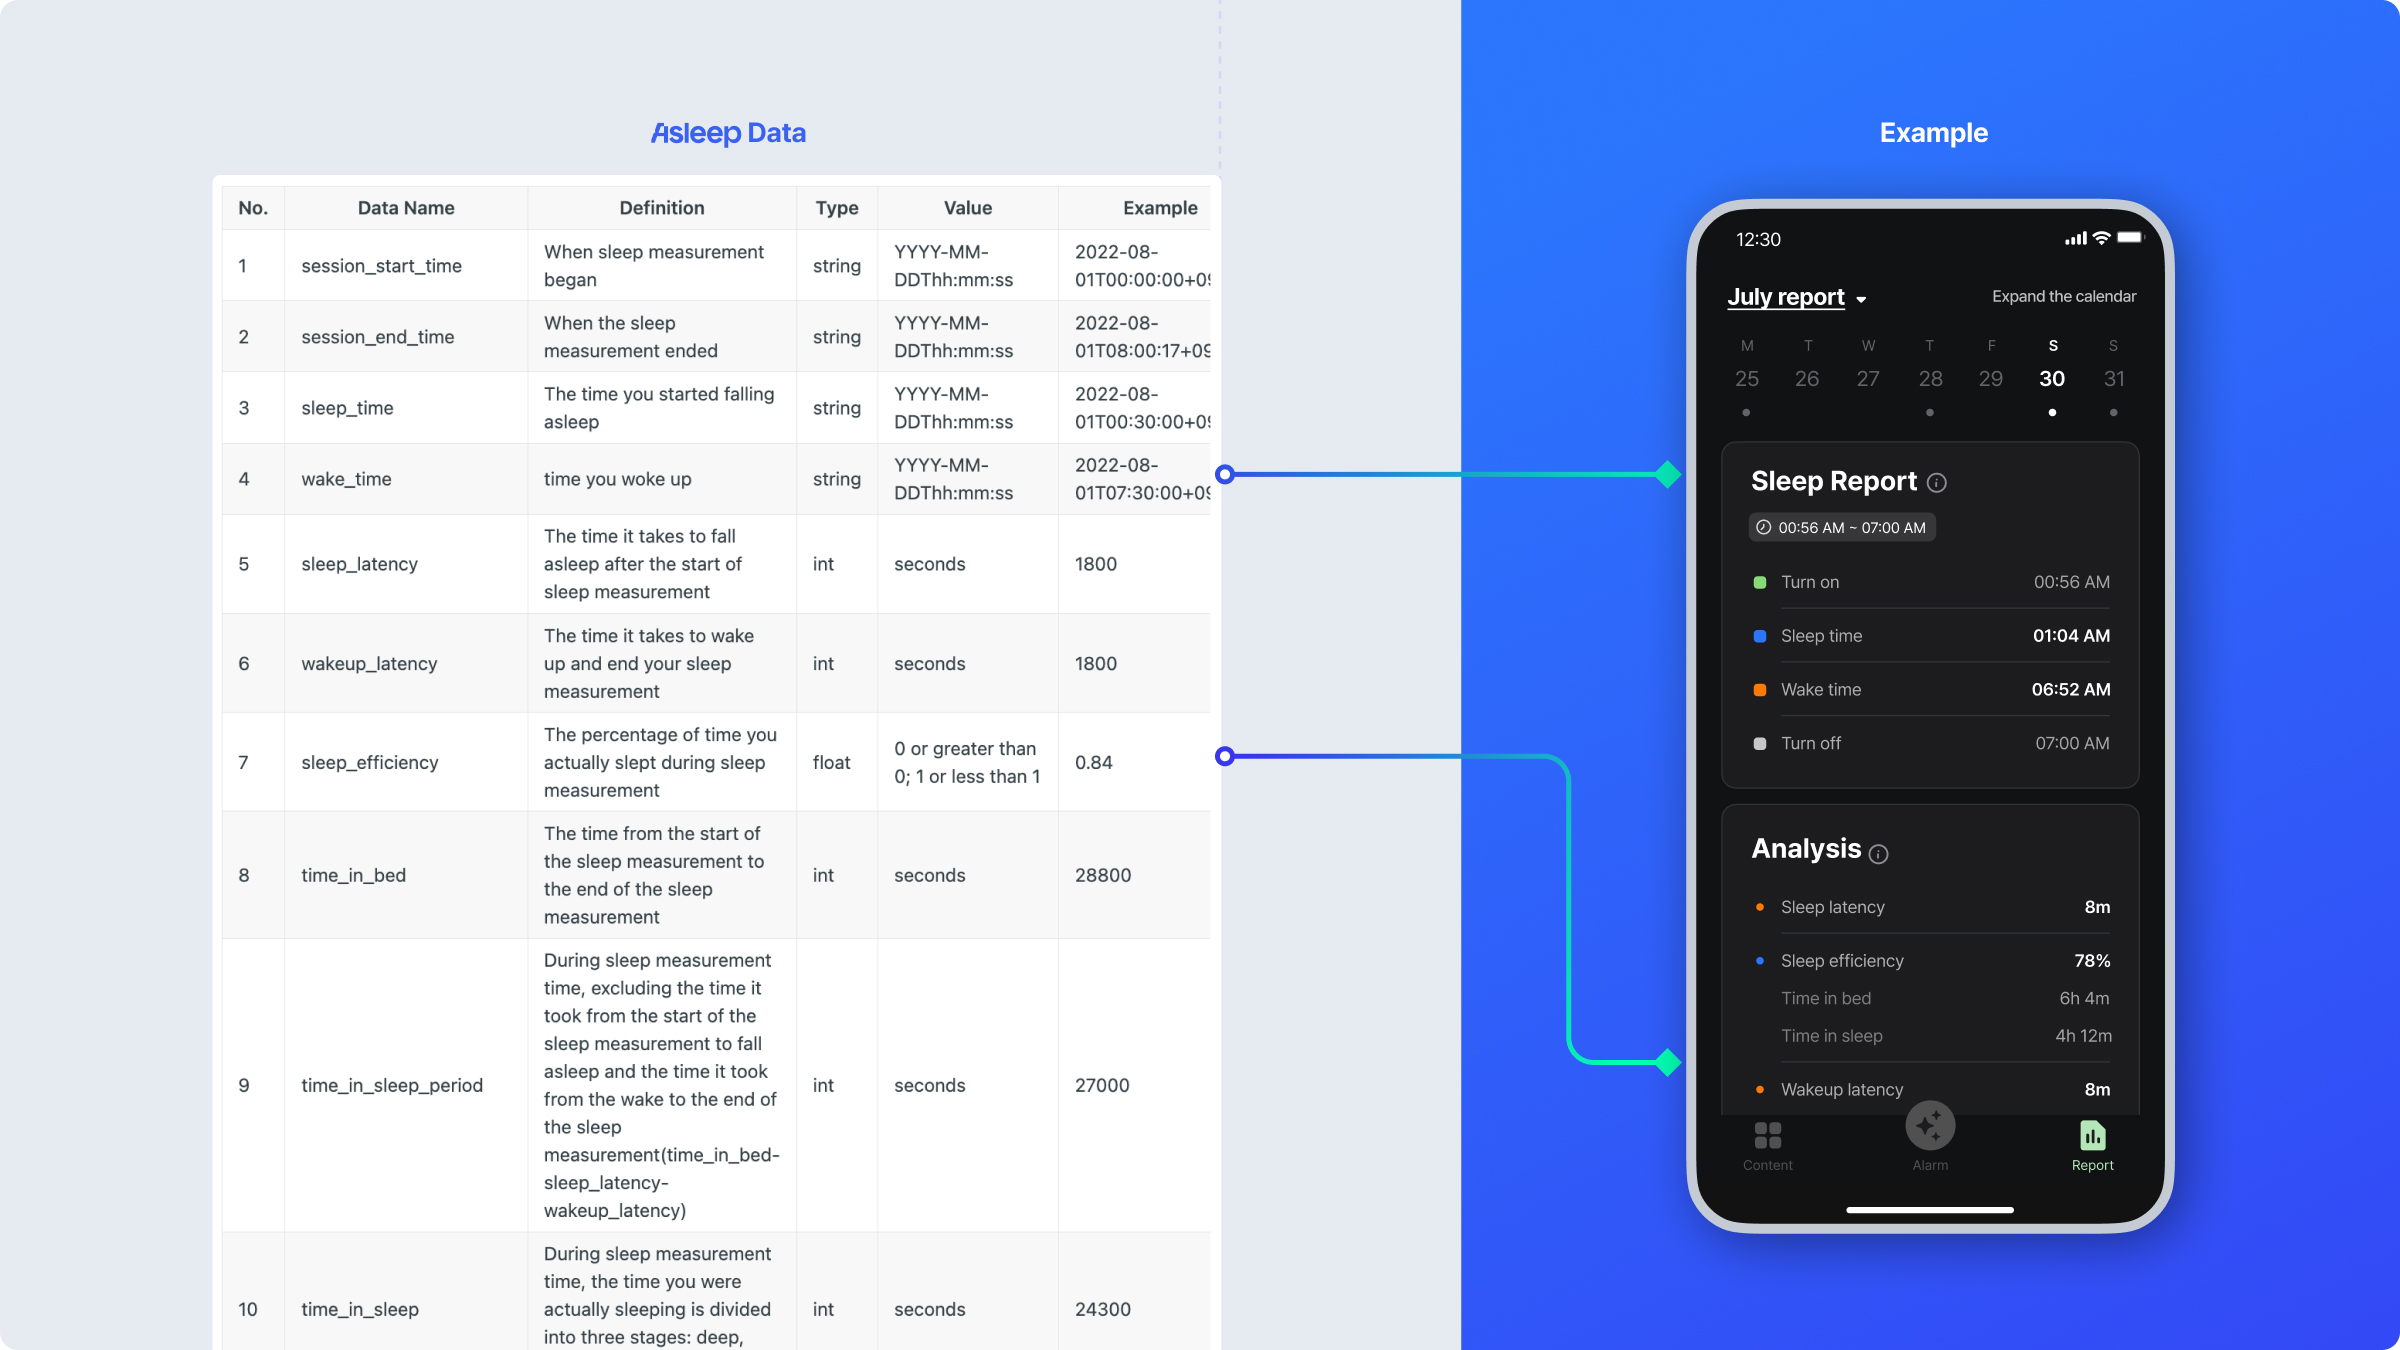
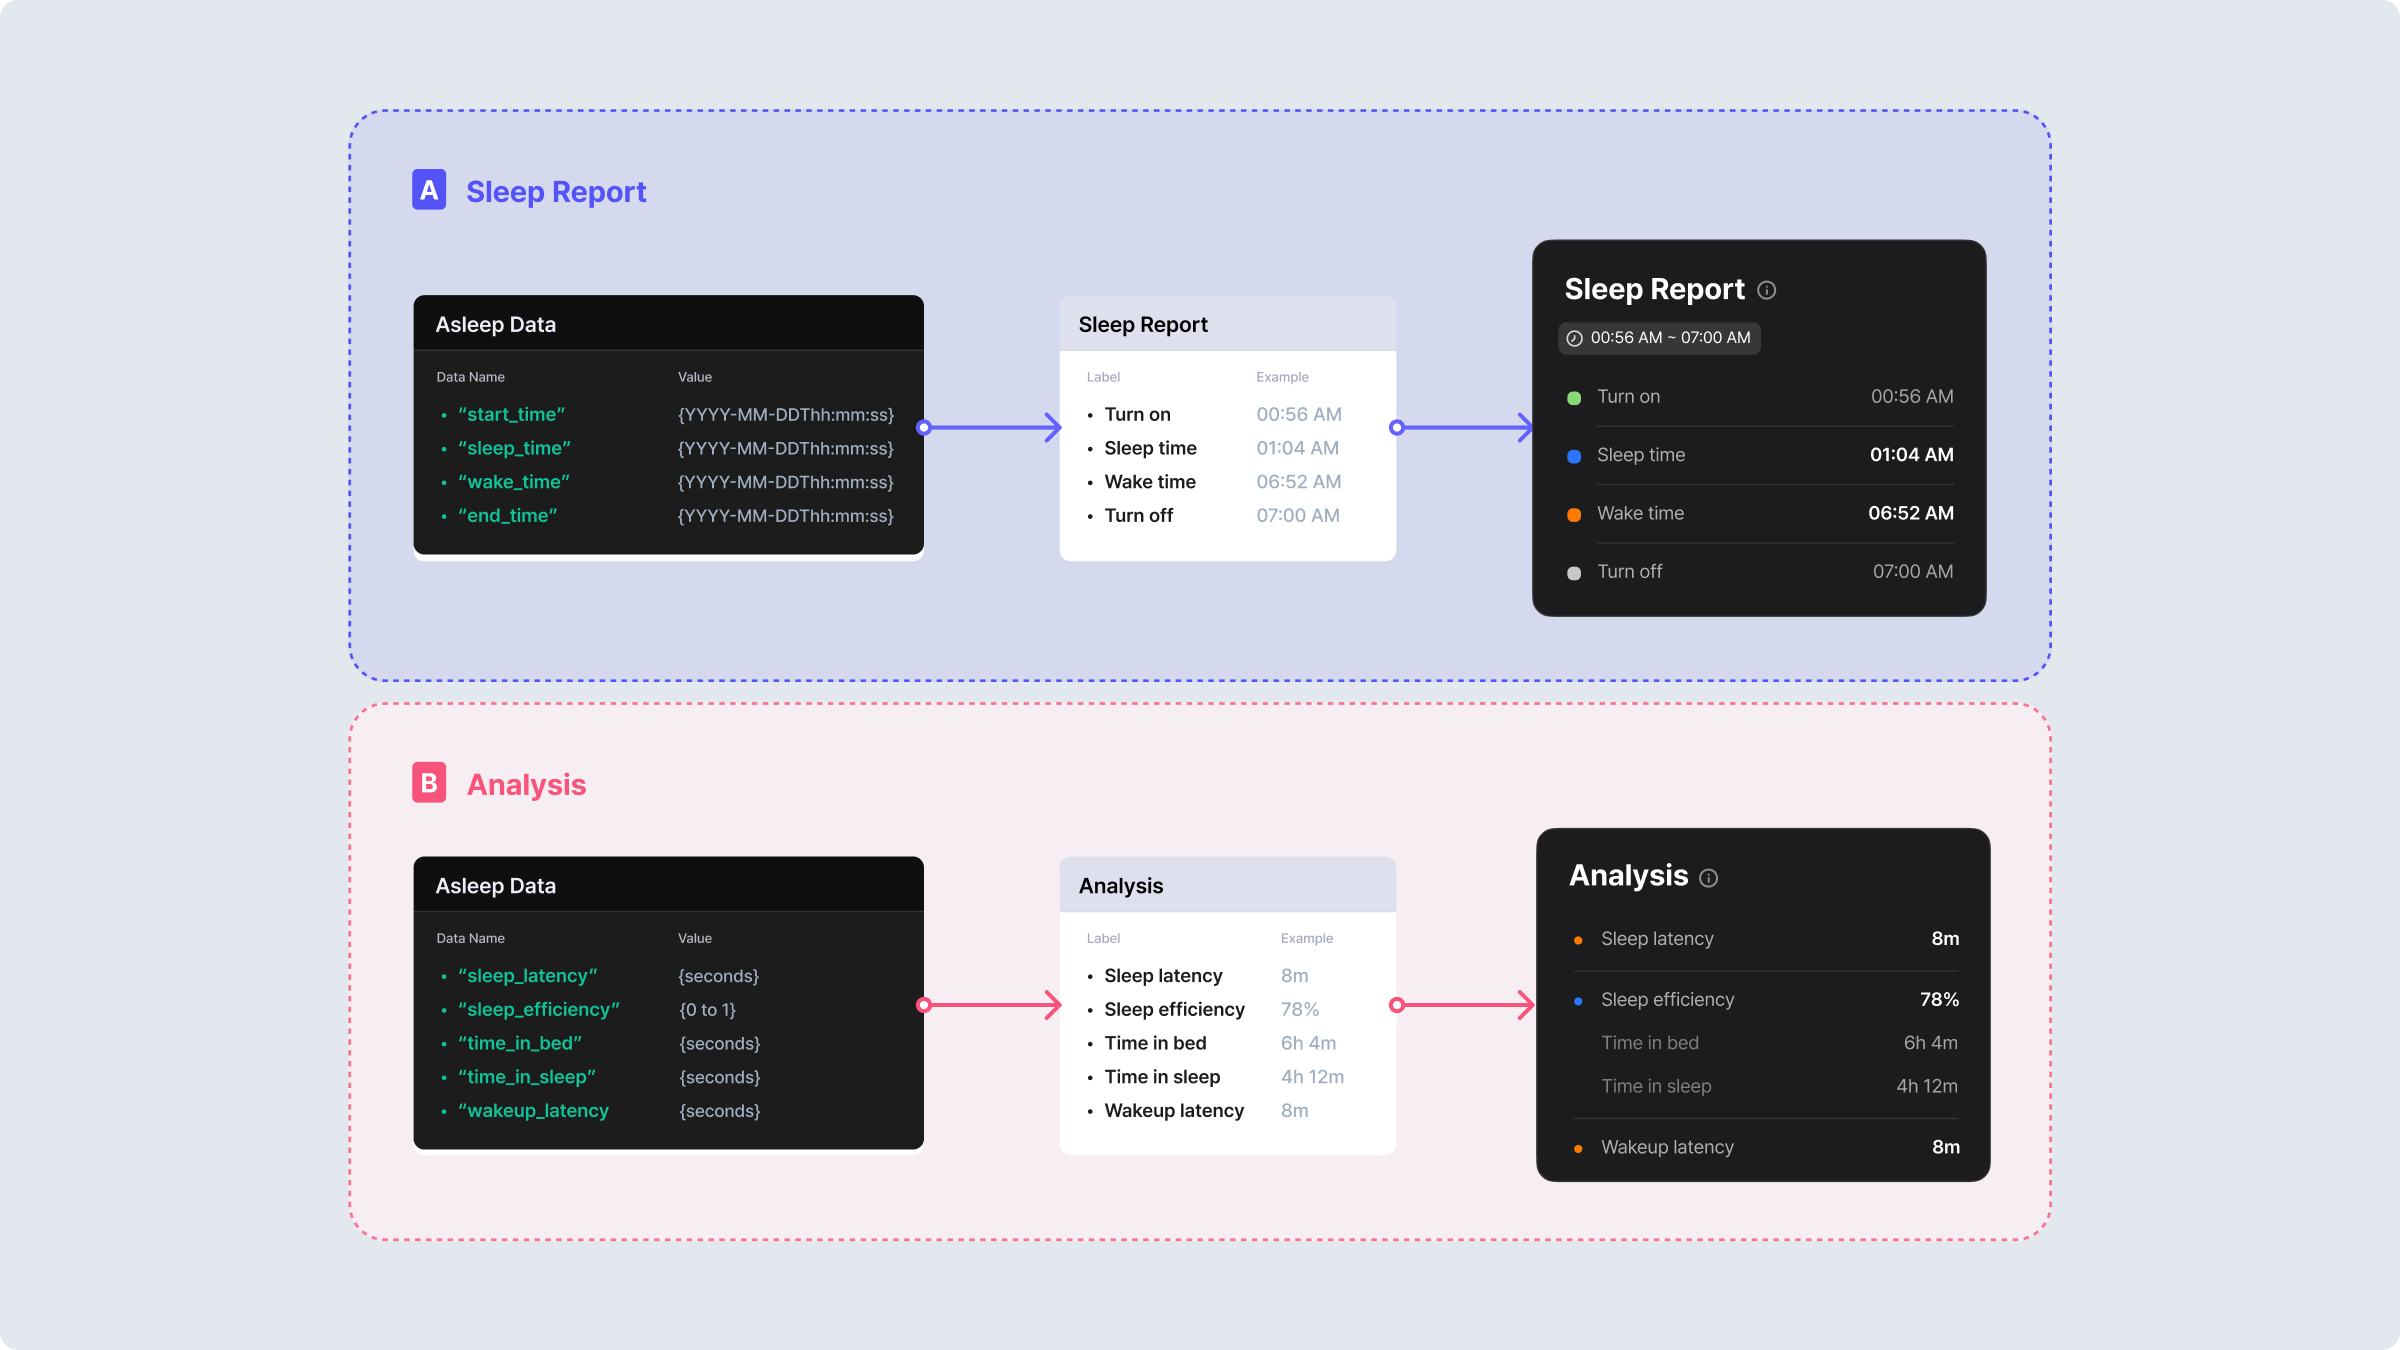
1. Basic Sleep Report
These pieces of information are basic sleep insights that can be derived from a two-stage analysis. With this information, you can provide essential and fundamental details about the user's sleep.
2. Sleep Stage Pattern
The sleep stage pattern graph is a valuable tool for understanding and analyzing sleep patterns. Through this graph, users can visually comprehend when they stayed in which sleep stages during their sleep and for how long they stayed in each stage.
3. Sleep Stage Ratio
The sleep stage ratio graph visualizes the proportion of each sleep stage during a user's sleep. Through this graph, users can understand their own sleep structure.
- The 'Wake' category in this graph represents periods of being awake/awakening during sleep and does not include sleep latency and wake latency times.
- If a session is measured where the user never slept, this graph will not be displayed.
4. Breathing Stability
This graph visualizes the stability of the user's breathing patterns during sleep.
Through this graph, users can quickly observe changes and stability in their breathing during sleep.
They can also check the regularity of their breathing and identify times when their breathing was more stable.
Looking to Integrate Asleep into Your Product?Talk to Asleep's Business Experts!
We'll Assist You in Enabling Smart Shut Off for Your Service Right Now.
Updated about 1 year ago